Gp galaxy

Identify and validate a consensus signature using gene expression data

Added by GenomeSpaceTeam on 2015.04.22 Official logo
Last updated on over 3 years ago.


Summary

Do phenotypically different expression datasets share a common signature? Can the signature distinguish phenotypes in an independent dataset?

This recipe provides one method for identifying a consensus gene signature from a training set of several phenotypically distinct gene expression dataset. The recipe then validates the ability of the consensus signature to accurately distinguish phenotypes by using an independent test gene expression dataset. An example use case of this recipe is when an investigator may want to develop a gene expression signature to predict a specific phenotype, such as cancer or another disease.


Background information: What is a consensus gene expression signature?

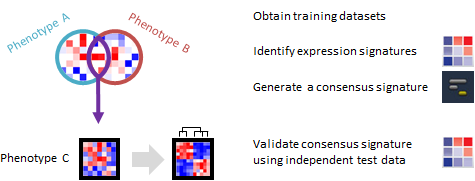
A gene expression signature is the pattern of expression in a specific group of genes, usually ones that are related by function, position or other biological process. A consensus gene signature is an expression pattern for a specific group of genes, which is shared among different samples or across different phenotypes. For example, a group of genes regulating immune response could be similarly up-regulated during many different, unrelated infections. There are several types of consensus signatures; those that can be derived from gene expression data are called transcriptional consensus signatures. Consensus signatures can be created by overlapping individual gene signatures derived from multiple datasets. Compared to individual gene expression signatures, consensus signatures may be more accurate at distinguishing different phenotypes, such as diseased vs. normal samples.


Use case: Targeting MYCN in Neuroblastoma by BET Bromodomain Inhibition (Puissant et al. , Cancer Discov. 2013).

This study analyzed gene expression data generated from primary neuroblastoma tumors of two genetic classes: tumors harboring MYCN amplification (“MYCN amplified”) and tumors without MYCN amplification (“MYCN non-amplified”). MYCN amplified neuroblastoma is exquisitely dependent on the bromodomain and extra-terminal (BET) family of proteins. As such, treatment of MYCN amplified cell lines or tumors with JQ1, a small-molecule inhibitor of BET proteins, leads to dramatic transcriptional changes and induces cell death.

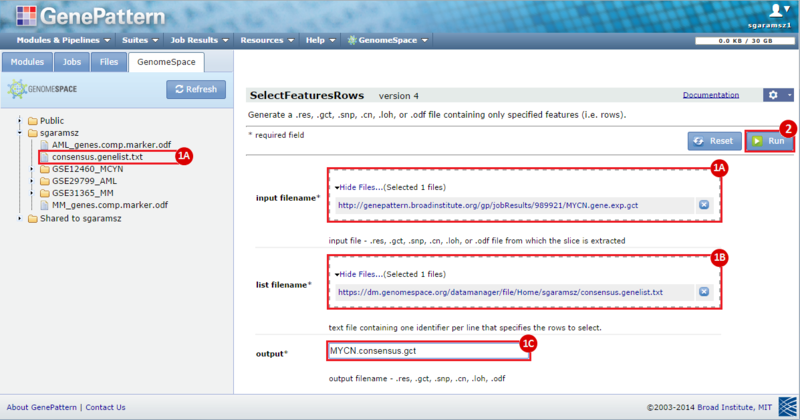
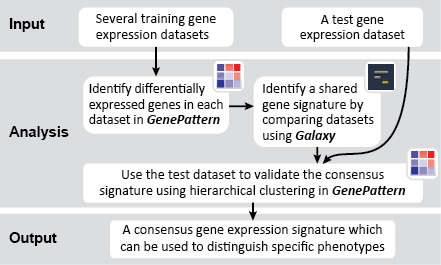
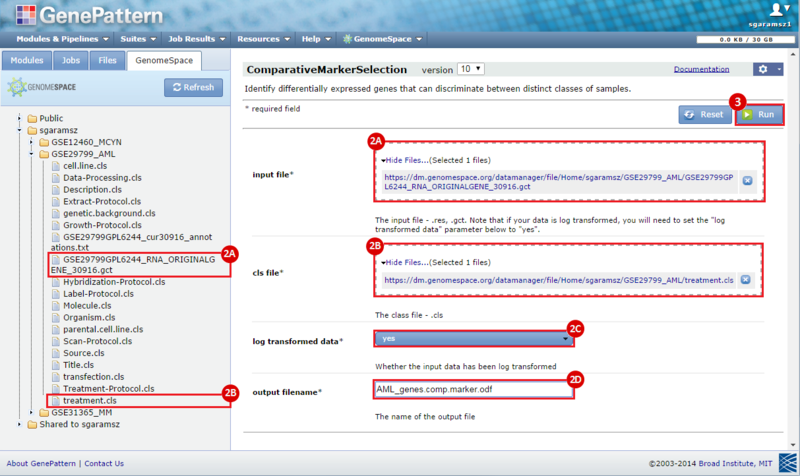
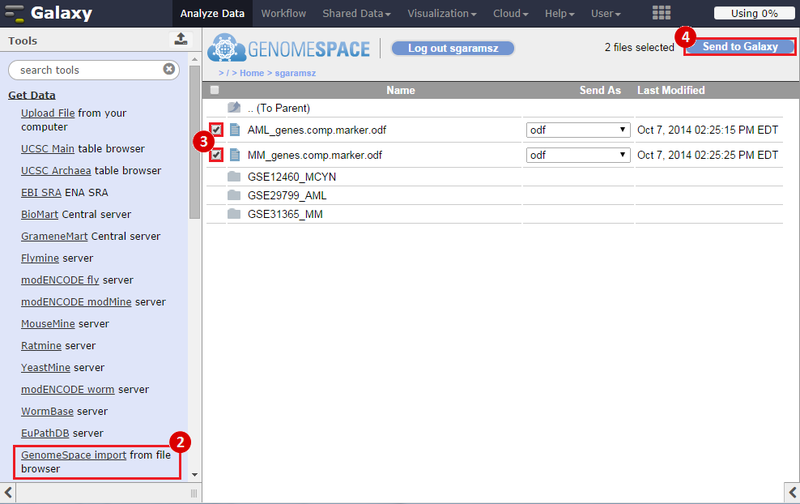
To identify a consensus signature to predict sensitivity to JQ1 treatment, two training datasets and one test dataset were used. The training dataset included acute myeloid leukemia (AML) and a multiple myeloid leukemia (MM) cell lines, which had been treated with either DMSO (control) or with JQ1 (treatment). The test dataset included MYCN amplified and MYCN nonamplified neuroblastoma primary tumor samples. GenePattern was used to analyze the AML and MM cell lines; for each dataset, a gene expression signature was derived to identify JQ1 response in the cell line. Using Galaxy, the two signatures were then overlapped to determine the consensus signature between the two phenotypes.

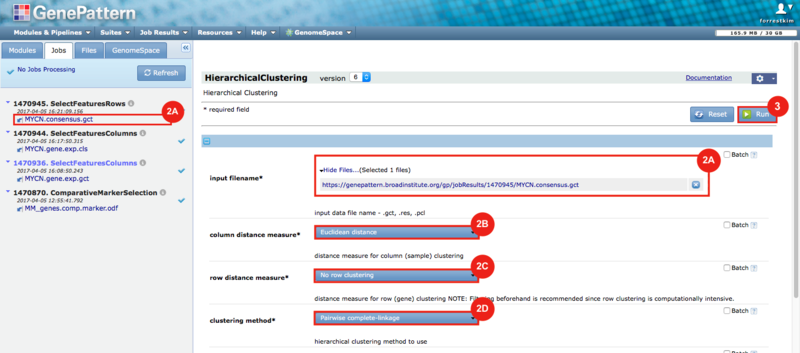
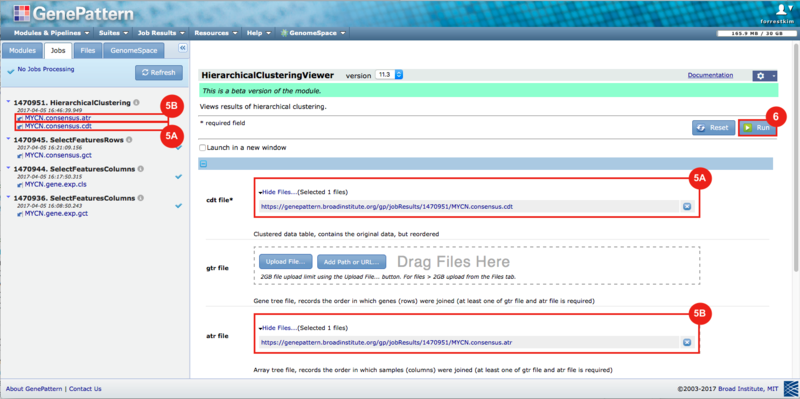
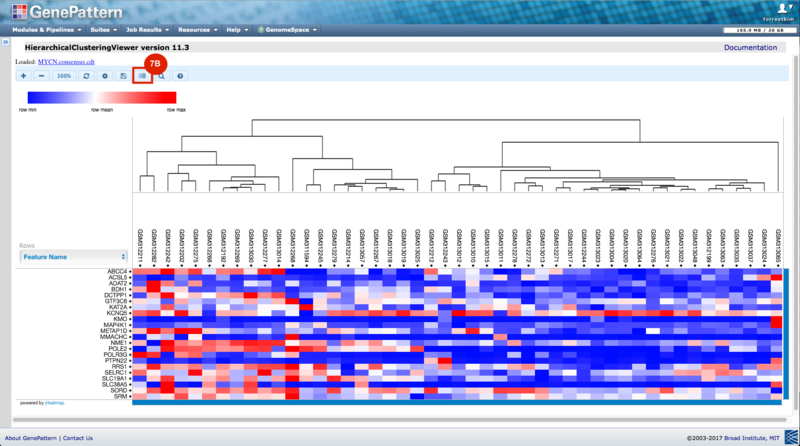
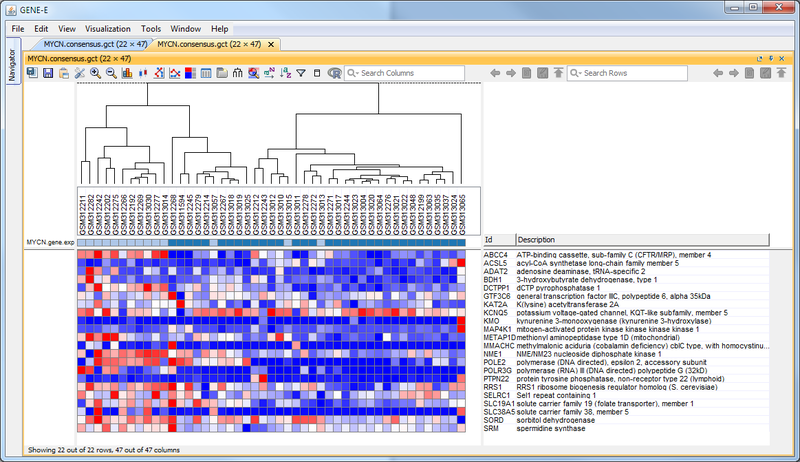
GenePattern was used to validate the ability of this JQ1-associated consensus signature to differentiate between phenotypes, by using the signature to hierarchically cluster the test dataset (neuroblastoma). Since the MYCN amplified and MYCN non-amplified neuroblastoma samples should have differing expression profiles, it was hypothesized that the consensus signature would be able to separate the samples by phenotype. Indeed, the consensus signature was able to cluster the MYCN-amplified and MYCN-nonamplified samples separately, revealing that the consensus signature accurately distinguishes the sensitivity-to-JQ1 phenotype.

Inputs

To complete this recipe, we will need several gene expression datasets:

  • Public > RecipeData > ExpressionData > GSE29799_AML: a JQ1-treated acute myeloid leukemia (AML) expression dataset (6 samples)
  • Public > RecipeData > ExpressionData > GSE31365_MM: a JQ1-treated multiple myeloma (MM) expression dataset (12 samples)
  • Public > RecipeData > ExpressionData > GSE12460_NB: a neuroblastoma (NB) expression dataset which has MCYN-amplified and MYCN-nonamplified samples (64 samples)

Outputs

Recipe steps

  • GenePattern
    1. Identifying differentially expressed genes in the JQ1-treated datasets
  • Galaxy
    1. Loading data into Galaxy
    2. Identifying a consensus gene signature by comparing the AML and MM datasets
  • GenePattern
    1. Processing the neuroblastoma dataset
    2. Projecting the consensus gene list onto the neuroblastoma dataset
    3. Validating the consensus signature using clustering

NOTE: If you have not yet associated your GenomeSpace account with your GenePattern account, you will be asked to do so. If you do not yet have a GenePattern account, you can automatically generate a new account that will be associated with your GenomeSpace account.

  1. Click on the GenePattern icon to launch the tool.
  2. Change to the Modules tab, and search for "ComparativeMarkerSelection". Once the module is loaded, change the following parameters:
    1. input file: load the AML GCT file, e.g., GSE29799GPL6244_RNA_ORIGINALGENE_XXXXX.gct. To do this, use the GenomeSpace tab to navigate to Public > RecipeData > ExpressionData > GSE29799_AML, then drag the file to the input box.
    2. cls file: load the AML treatment CLS file, e.g., treatment.cls, also located in the GSE29799_AML directory.
    3. log transformed data: yes
    4. output filename: AML_genes.comp.marker.odf
  3. Click Run to run ComparativeMarkerSelection on the AML dataset.


  4. Once the job has finished running, save the resulting file back to GenomeSpace:
    1. Click on the file, and choose Save to GenomeSpace.
    2. Navigate to a directory of your choice and choose Save.
  5. Repeat these steps to identify differentially expressed genes for the MM dataset, GSE31365. Change the following parameters:
    1. input file: load the MM GCT file, e.g., GSE31365GPL6244_RNA_ORIGINALGENE_XXXXX.gct. To do this, use the GenomeSpace tab to navigate to Public > RecipeData > ExpressionData > GSE31365_MM, then drag the file to the input box.
    2. cls file: load the MM treatment CLS file, e.g., treatment.cls, also located in the GSE31365_MM directory.
    3. log transformed data: yes
    4. output filename: MM_genes.comp.marker.odf
  6. Click Run to run ComparativeMarkerSelection on the MM dataset.
  7. Once the job has finished running, save the resulting file back to GenomeSpace, as before:
    1. Click on the file, and choose Save to GenomeSpace.
    2. Navigate to a directory of your choice and choose Save.
  8. Optional: close GenePattern.

NOTE: If you have not yet associated your GenomeSpace account with your Galaxy account, you will be asked to do so. If you do not yet have a Galaxy account, you can automatically generate a new account that will be associated with your GenomeSpace account.

  1. Click on the Galaxy icon to launch the tool.
  2. Navigate to the following menu: Get Data > GenomeSpace import
  3. Select the AML_genes.comp.marker.odf and MM_genes.comp.marker.odf files.
  4. Click Send to Galaxy.
  5. Once the files have been loaded, change the attributes for each file, by clicking the pencil icon and changing the following parameters:
    1. Switch to the Datatype tab.
    2. New type: tabular
    3. Click Save. Ignore any warnings which may pop up.
     

  1. Click on the following link: Official GenomeSpace Galaxy Workflow: Identify and Validate a Consensus Signature Using Gene Expression Data.
  2. Click the icon in the upper right corner to import the workflow.
  3. Click start using this workflow.
  4. Click on the workflow drop-down menu (e.g., imported: Identify and Validate a Consensus Signature Using Gene Expression Data), then choose Run.
  5. Load the files into the correct fields. The input fields should have annotation indicating which file should be loaded:
    1. Step 1: Input Dataset: AML_genes.comp.marker.odf
    2. Step 2: Input Dataset: MML_genes.comp.marker.odf
    3. Choose Target Directory: choose a directory to save the file to, e.g. your home directory.
  6. Click Run workflow.


  7. Once the workflow has finished running, the files will automatically saved to your GenomeSpace folder that was chosen in Step 5C.
  8. Optional: close Galaxy.
  1. Click on the GenePattern icon to launch the tool.
  2. Change to the Modules tab, and search for SelectFeaturesColumns. Once the module is loaded, change the following parameters:
    1. input filename: use the GenomeSpace tab to navigate to Public > RecipeData > ExpressionData > GSE12460, then click and drag to load the neuroblastoma GCT file, e.g., GSE12460GPL750_RNA_ORIGINALGENE_XXXX.gct.
    2. columns: 0-2, 4-6, 8-16, 18-19, 21-25, 28, 30-36, 38-54
    3. output: MYCN.gene.exp.gct
  3. Click Run.


  4. Change to the Jobs tab, and reload the SelectFeaturesColumns module by clicking on the job and choosing Reload Job.
  5. Once the module is loaded, change the following parameters:
    1. input filename: load the neuroblastoma CLS file, e.g., Myc.Expression.cls. To do this, click the 
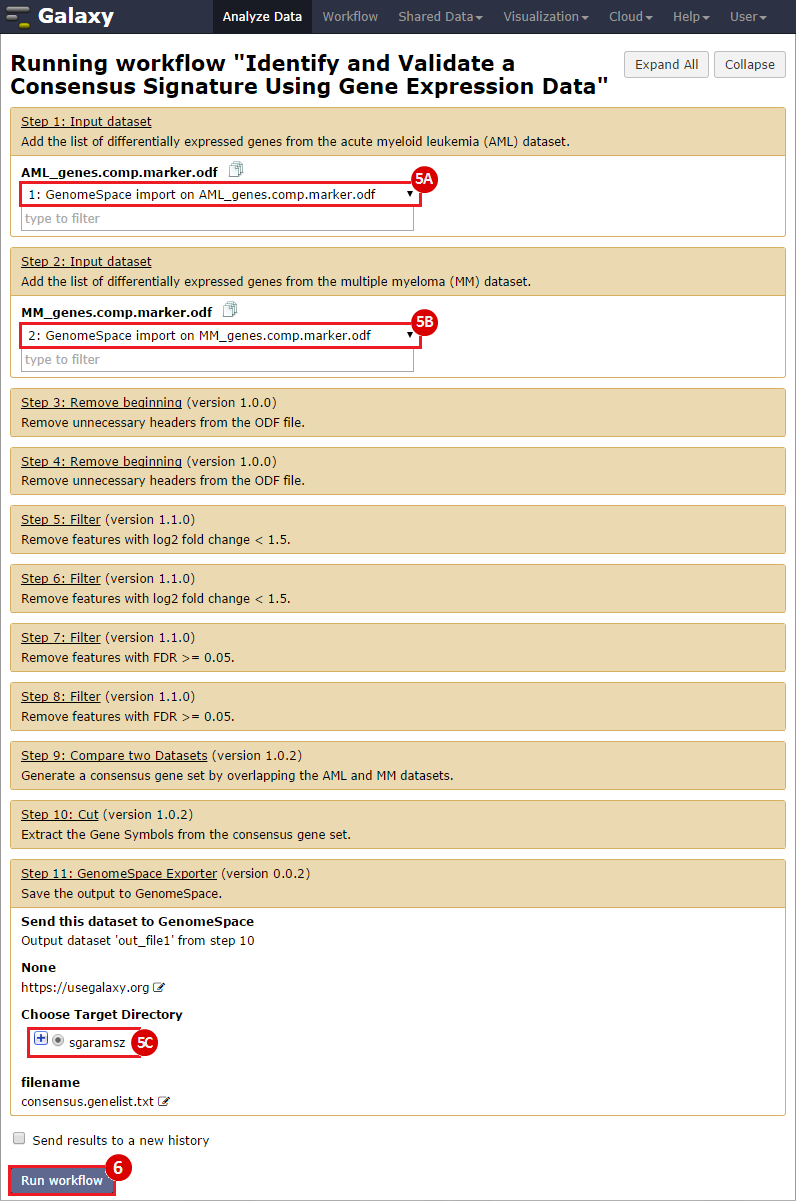
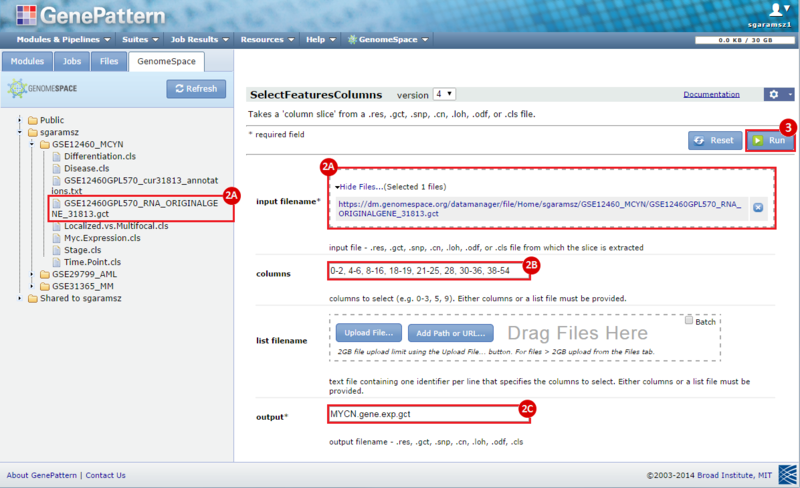
next to the input filename parameter to remove the GCT file from the module. Then, use the GenomeSpace tab to navigate to the GSE12460_MYCN directory: Public > RecipeData > ExpressionData > GSE12460, then drag the file to the input box.
    2. output: MYCN.gene.exp.cls
  6. Click Run.
  7. Once the CLS file has been generated, click on the file and choose Save File to download a copy of this to your local computer. We will need this file to be downloaded locally for a later step.
  1. Change to the Modules tab, and search for "SelectFeaturesRows". Once the module is loaded, change the following parameters:
    1. input filename: MYCN.gene.exp.gct, the previously filtered neuroblastoma GCT file. To do this, use the Jobs tab to find the previous job results, then drag the file to the input box.
    2. list filename: consensus.genelist.txt, the consensus signature gene list. To do this, use the GenomeSpace tab to navigate to the directory containing the consensus signature gene list, then drag the file to the input box.
    3. output: MYCN.consensus.gct
  2. Click Run.


  1. Change to the Modules tab, and search for HierarchicalClustering.
  2. Once the module is loaded, change to the Jobs tab, then change the following parameters:
    1. input file: MYCN.consensus.gct (output from SelectFeaturesRows).
    2. column distance measure: Euclidean distance
    3. row distance measure: No row clustering
    4. clustering method: Pairwise complete-linkage
  3. Click Run.


  4. Once the job has finished running, change to the Modules tab and search for HierarchicalClusteringViewer.
  5. Once the module is loaded, change to the Jobs tab, then change the following parameters:
    1. cdt file: MYCN.consensus.cdt
    2. atr file: MYCN.consensus.atr
  6. Click Run.


  7. Once HierarchicalClusteringViewer has loaded, you should see a heatmap fo the original MYCN.consensus.gct file. To color the samples by phenotype, change the following parameters:
    1. Click the add/edit labels button.
    2. Make sure the "Samples" type of label is selected, then click the "Add Label" button.
    3. Choose the MYCN.consensus.cls file you downloaded to your local directory from Step 5.
    4. Click "OK". This should color the samples according to the labels in the CLS file.


Results Interpretation

This is an example interpretation of the results from this recipe. First, we identified a consensus gene signature of JQ1 activity by finding genes that became differentially expressed due to JQ1 treatment in both acute myeloid leukemia (AML) and multiple myeloma (MM). Then, we projected this consensus signature on a test dataset of neuroblastoma cells which were not treated with JQ1, but were either MYCN-amplified or MYCN-nonamplified. Since MYCN amplification is associated with an increased sensitivity to BET bromodomain inhibitors, such as JQ1, we expected that a signature of JQ1 activity would be able to separate MYCN-amplified and MYCN-nonamplified phenotypes.

These results suggest that the JQ1 consensus signature is capable of differentiating between MYCN-amplified neuroblastoma and MYCN-nonamplified neuroblastoma samples. In particular, we see that when we use hierarchical clustering to differentiate the two phenotypes, we observe three distinct groups of samples: (1) the majority of the MYCN-amplified samples (left cluster, light blue); (2) MYCN-nonamplified samples that are similar to MYCN-amplified samples (middle cluster, dark blue); and (3) MYCN-nonamplified samples which are distinct from MYCN-amplified samples (right cluster, dark blue). The significance of this possible result would need further confirmation.


Posted by xiaojuw on March 01, 2016 03:47

Submit a Comment

History