Gp msigdb galaxy

Use Gene Set Enrichment Analysis to identify common signatures between gene sets

Added by GenomeSpaceTeam on 2015.05.06 Official logo
Last updated on over 3 years ago.


Summary

How do I create a custom-generated gene set? Are there any commonalities between custom-generated gene sets, and MSigDB hallmark gene sets?

This recipe provides a method for identifying and visualizing similarities between diverse gene sets relevant to a study. An example use of this recipe is a case where an investigator may want to compare two phenotypes, such as two types of cancer, to determine which gene sets may be similar between these phenotypes.


Background information: What is Gene Set Enrichment Analysis, and why should I use it?

Gene sets are lists of genes that share similar functions, transcriptional regulation, chromosomal positions, pathways, or other biological processes. It is possible to identify gene sets that are enriched or over-represented in a particular phenotype, such as a specific disease. Gene Set Enrichment Analysis (GSEA) is a computational method which determines whether an a priori defined set of genes shows statistically significant, concordant differences between two phenotypes. GSEA can be used with a custom gene set generated by the user, or with the annotated, standardized gene sets which are available in the Molecular Signatures Database (MSigDB) collection. Completing GSEA on a gene expression dataset will identify those gene sets which are significantly enriched in a particular phenotype. Comparing similarities between the top gene sets following GSEA can yield unique insights into the mechanisms associated with a specific phenotype, which cannot be observed using a single-gene analysis.


Use case: Targeting MYCN in Neuroblastoma by BET Bromodomain Inhibition (Puissant et al. , Cancer Discov. 2013).

This study analyzed gene expression data generated from primary neuroblastoma tumors of two genetic classes: tumors harboring MYCN amplification (“MYCN amplified”) and tumors without MYCN amplification (“MYCN non-amplified”). MYCN amplified neuroblastoma is exquisitely dependent on the bromodomain and extra-terminal (BET) family of proteins. As such, treatment of MYCN amplified cell lines or tumors with JQ1, a small-molecule inhibitor of BET proteins, leads to dramatic transcriptional changes and induces cell death.

A training set of gene expression data was analyzed using GenePattern, and custom gene sets were generated representing the MYCN amplified and MYCN non-amplified datasets. The custom-generated gene sets were then concatenated with the Hallmark gene set from MSigDB using tools in Galaxy. Subsequently, a test gene expression dataset of neuroblastoma cell lines treated with JQ1 (treatment) or DMSO (control) was used to rank this collection of gene sets using single-sample Gene Set Enrichment Analysis (ssGSEA).

This analysis reveals that MYCN-associated gene sets are enriched in JQ1-associated datasets, and suggests that JQ1 functions to suppress transcriptional programs mediated by MYCN amplification. The resulting similarities of the top-ranked gene sets are visualized using ConstellationMap, a module available in GenePattern. This helps to highlight similarities and overlaps between gene sets.

Inputs

To complete this recipe, we will need a gene expression dataset describing two conditions or phenotypes. In this example, we will use microarray samples from primary neuroblastoma tumors that have been categorized into tumors with amplification of MYCN, and tumors without amplification of MYCN. We will use this data to derive MYCN-associated gene sets. Then, we will also need a test dataset to complete gene set enrichment analysis of our MYCN-associated gene sets. We will use a test microarray dataset of neuroblastoma cell lines, which have either been treated with JQ1 (treatment), or with DMSO (control). We will need the following datasets, which can be downloaded from the following GenomeSpace Public folder:

A neuroblastoma primary tumor dataset (GSE12460):

Public > RecipeData > ExpressionData > MYCN.gct: This file contains gene expression data of two phenotypes: MYCN-amplified and MYCN-nonamplified. The file is available in GenePattern's GCT format.

Public > RecipeData > ExpressionData > MYCN.cls: This file contains class assignments (MYCN+ or MYCN-) for all the samples in the GCT file, as identified by the GenePattern CLS format.

A test gene expression dataset (GSE43392):

Public > RecipeData > ExpressionData > GSE43392null.collapsed.gct: This file contains gene expression data of neuroblastoma cell lines treated with either JQ1 (treatment) or with DMSO (control). The file is available in GenePattern's GCT format. The file has already been preprocessed, normalized, and probe IDs have been collapsed to HUGO Gene Symbols.

Public > RecipeData > ExpressionData > GSE43392.cls: This file contains class assignments (treatment or control) for all the samples in the GCT file, as identified by the GenePattern CLS format.

Outputs

Recipe steps

  • GenePattern
    1. Identify differentially expressed genes
    2. Extract highly differentially expressed genes
  • MSigDB
    1. Obtain an MSigDB gene set
  • Galaxy
    1. Merge different gene sets
  • GenePattern
    1. Run single-sample gene set enrichment analysis (ssGSEA)
    2. Visualize ssGSEAProjection results using ConstellationMap

  1. Launch GenePattern from GenomeSpace.
  2. Change to the Modules tab, and search for "ComparativeMarkerSelection".
  3. Once the module has loaded, change the following parameters:
    1. input file: MYCN.gct (found in the Public > RecipeData > ExpressionData folder)
    2. cls file: MYCN.cls (found in the Public > RecipeData > ExpressionData folder)
    3. log transformed data: yes
  4. Click Run to run ComparativeMarkerSelection.

  1. Change to the Modules tab, and search for "ComparativeMarkerSelectionViewer".
  2. Once the module has loaded, change the following parameters:
    1. comparative marker selection filename: MYCN.comp.marker.odf
    2. dataset filename: MYCN.gct (found in the Public > RecipeData > ExpressionData folder)
  3. Click Run to run ComparativeMarkerSelectionViewer.

  4. Once the job has completed, a visualizer should launch automatically. If it does not, click the Launch button to launch the visualizer. Once the visualizer loads the file, select the genes which are significantly up-regulated in the MYCN amplified phenotype, as follows:
    1. Navigate to the following menu: Edit > Filter Features > Create/Edit Filter.

    2. Change the following parameters:
      1. Select T-Test from the dropdown menu.
      2. Enter 0 in the <= box to the right of T-Test.
      3. Click Add Filter.
      4. Select FDR(BH) from the dropdown menu.
      5. Enter 0.01 in the <= box to the right of FDR(BH).
      6. Click OK to filter the dataset.
    3. Save the resulting filtered data by clicking the box to the left of the Rank header to select all rows, then navigating to the following menu: File > Save Dataset(.gct). Change the following parameters:
      1. Give the file a name, e.g. MYCN_amplified_up.gct
      2. Click the Download button then Create. This will save the file to your local directory.
      3. Click Close
  5. Next, select the genes which are significantly up-regulated in the MYCN nonamplified phenotype, as follows:
    1. Navigate to the following menu: Edit > Filter Features > Create/Edit Filter.
    2. Using the same filter, change the following parameters:
      1. Enter 0 in the >= box to the right of T-Test.
      2. Leave the remaining filter parameters as-is.
      3. Click OK to filter the dataset.
    3. Save the resulting filtered data by clicking the box to the left of the Rank header to select all rows, then navigating to the following menu: File > Save Dataset(.gct). Change the following parameters:
      1. name, e.g. MYCN_nonamplified_up.gct
      2. click the Download button then Create. This will save the file to your local directory.
      3. click Close
  6. Save the files back to GenomeSpace by navigating to your local directory, then clicking and dragging the files into your GenomeSpace account.
  7. Convert each file to the GMT format, as follows:
    1. Right-click the file and choose Convert
    2. Choose gmt
    3. Click Convert on Server
  1. Launch MSigDB from GenomeSpace.
  2. Navigate to the Downloads tab on the MSigDB website.
  3. Scroll down to "Older version of MSigDB" and click on "Archived Downloads". 
  4. Scroll down until you find the "MSigDB version 5.1, January 2016". Click on "download zip file" to download it to your local directory.
  5. Save the file to GenomeSpace (click and drag).

  1. Launch Galaxy from GenomeSpace.
  2. Import the gene sets from GenomeSpace.
    1. Navigate to the following menu: Get Data > GenomeSpace Import.
    2. Once the tool is loaded, navigate through your user directory. Select the following files:
      1. h.all.v5.1.symbols.gmt
      2. MYCN_amplifed_up.gmt
      3. MYCN_nonamplifed_up.gmt
    3. Click Send to Galaxy to upload them to Galaxy.

  3. Concatenate the files together into one file.
    1. Navigate to the following menu: Text Manipulation > Concatenate Datasets. Once the tool is loaded, change the following parameters:
    2. Concatenate Dataset: MYCN_amplified_up.gmt
    3. Click Insert Dataset to add a new dataset.
    4. Concatenate Dataset: MYCN_nonamplified_up.gmt
    5. Click Insert Dataset to add a new dataset.
    6. Concatenate Dataset: h.all.v5.1.symbols.gmt
    7. Click Execute to run the job.
  4. Once the job has finished running, send the resulting file back to GenomeSpace.
    1. Navigate to the following menu: Send Data > GenomeSpace Exporter. Once the tool is loaded, change the following parameters:
    2. Send this dataset to GenomeSpace: concatenate datasets….
    3. Choose Target Directory: your directory
    4. Filename: concatenated_genesets.gmt
    5. Click Execute to run the job.
  5. Once the job has completed, return to GenomeSpace.
  1. Launch GenePattern from GenomeSpace.
  2. Change to the Modules tab, and search for "ssGSEAProjection". Once the module has loaded, change the following parameters:
    1. input gct file: GSE43392null.collapsed.gct
    2. output file prefix: GSE43392.ssGSEA.output
    3. gene sets database file: concatenated_genesets.gmt
    4. combine mode: combine.off
      NOTE: 'collapse mode' is set to 'combine.off' to prevent the module from creating new gene sets by combining sets with _UP or _DN suffixes in their names.
  3. Click Run to run the job. This will produce a new GCT file of the ssGSEA projection with gene sets as rows, samples as columns, and enrichment scores as elements.
  1. Change to the Modules tab, and search for "ConstellationMap". Once the module has loaded, change the following parameters:
    1. input gct file: GSE43392.ssGSEA.output.gct
    2. input cls file: GSE43392.cls
    3. gene sets file: concatenate_genesets.gmt
    4. top n: 20
    5. direction: negative
    6. jaccard threshold: 0.05
    7. target class: JQ1

  2. Click Run to run the job. This will produce several output files.
  3. Click the file, Visualizer.html, then Open Link, to launch a new webpage. This webpage is an interactive, in-browser radial plot.

Results Interpretation

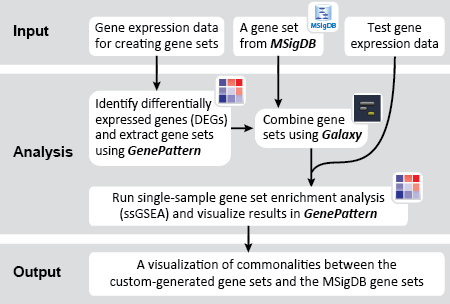
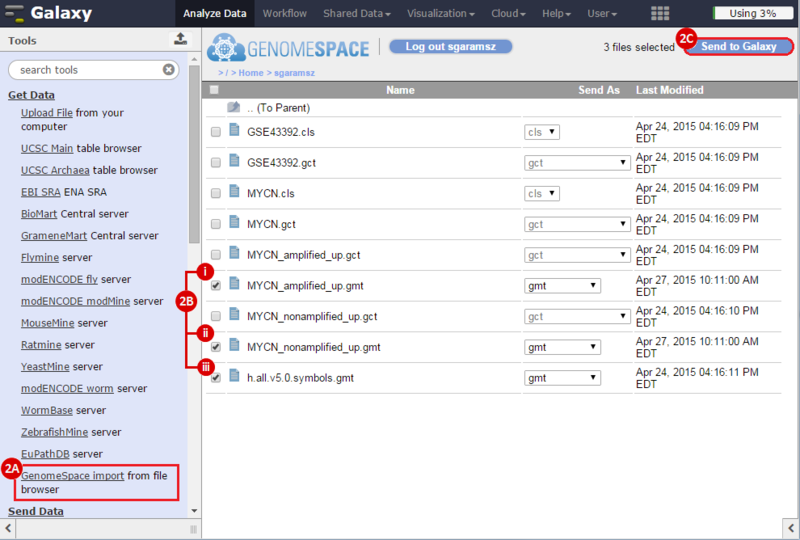
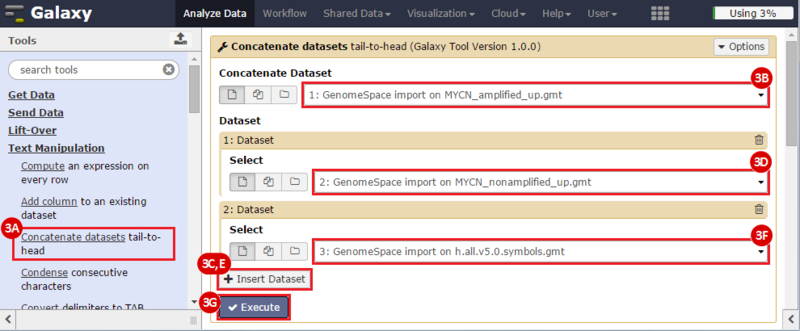
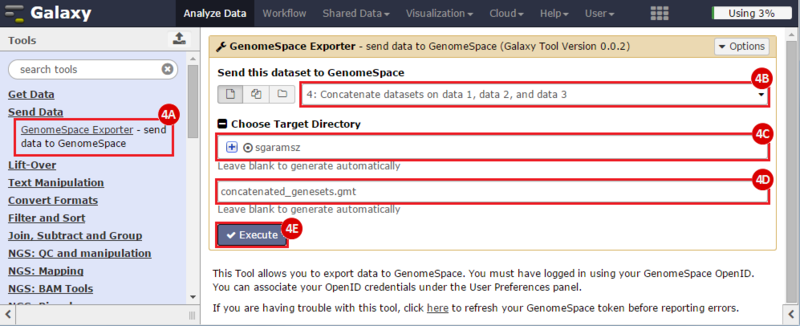
This is an example interpretation of the results from this recipe. First, we identified sets of genes that are significantly up- or down-regulated in MYCN amplified vs. MYCN non-amplified neuroblastoma tumors. We built a personalized collection of gene sets by combining these two new gene sets, MYCN_amplified_up and MYCN_nonamplified_up, with the Hallmarks collection gene set collection from MSigDB.

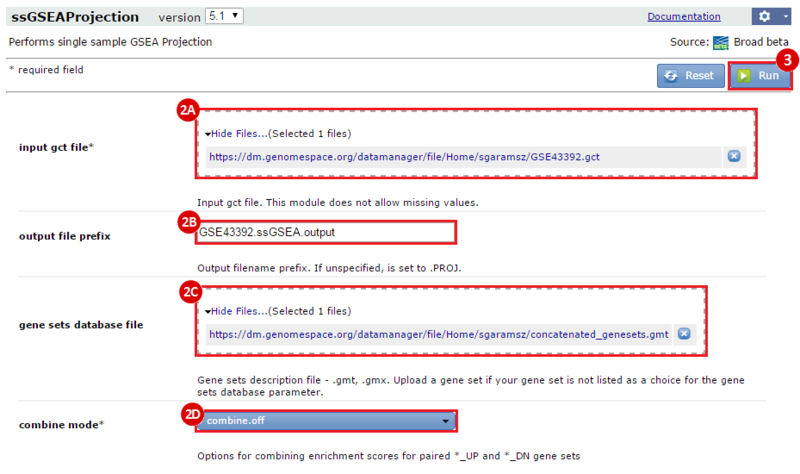
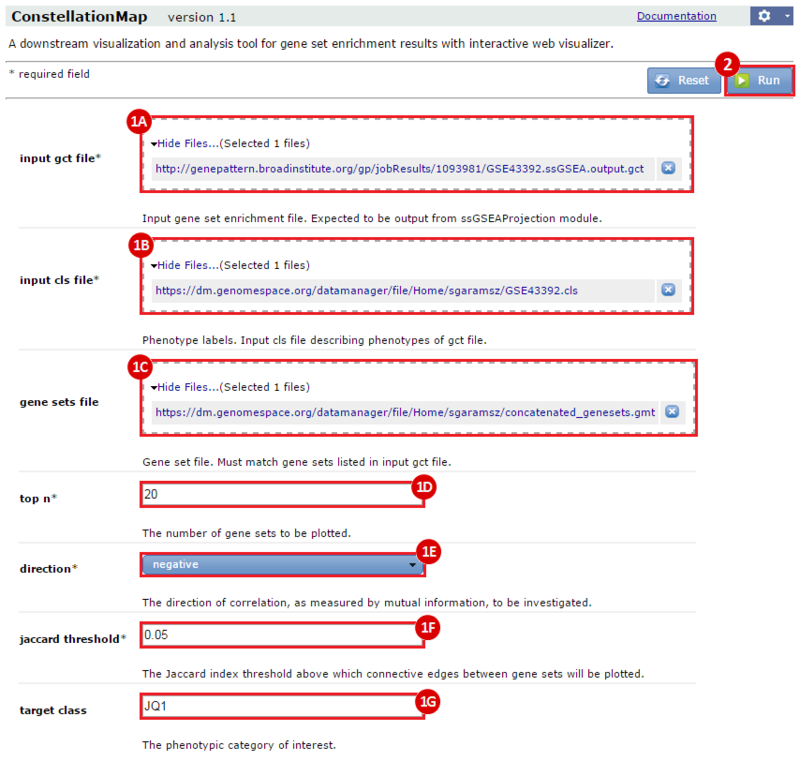
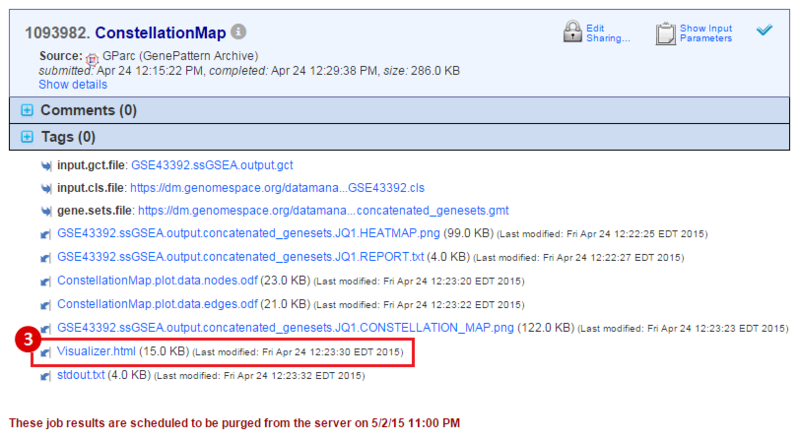
Next, we investigated whether any of the gene sets in our combined collection were significantly enriched in neuroblastoma cell lines treated with DMSO (control) compared with those treated with JQ1. We used the ssGSEAProjection module to get per sample enrichment values for each gene set. Then, we compared these gene set enrichment profiles against each other, and against the JQ1 treatment vs. control phenotype, using the ConstellationMap module.

Given the effects of JQ1, we expect that MYC and MYCN associated gene sets, including our new signature-based gene sets, will have enrichment profiles that are significantly associated with controls compared to JQ1-treated samples.

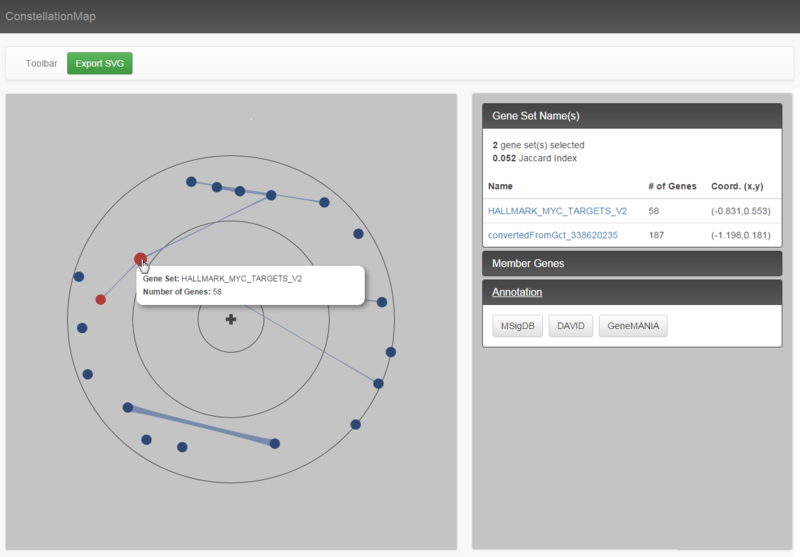
Our results seem to suggest that MYC and MYCN-amplification programs (highlighted) are indeed affected by JQ1 treatment, being highly anti-correlated to JQ1-treated samples and having similar enrichment profiles. Moreover, these gene sets share 12 genes that may be further investigated as markers for JQ1 susceptibility. As investigators, we could continue to investigate clusters of any of the other highly associated gene sets for potential leads in the search for downstream effects of JQ1 treatment. As these are investigative steps, the significance of any results would need further confirmation. 


Submit a Comment

History