Genomica cy3

Create and visualize a module network of regulatory genes

Added by GenomeSpaceTeam on 2015.05.22 Official logo
Last updated on over 3 years ago.


Summary

Does my gene expression dataset contain a module network of regulatory genes? Does the network have any special features?

This recipe provides one method for creating and visualizing a module network of regulatory genes. An example use of this recipe is a case where an investigator may want to evaulate an expression dataset to find regulatory genes such as transcription factors, and then determine if they are connected in a network.


In particular, the regulatory genes of interest are genes which regulate other genes associated with an embryonic stem cell (ESC) state. This 'stemness signature' is a feature common to ESCs, as well as induced pluripotent stem cells (iPSCs), and also in a compendium of human cancers, such as breast cancer. This recipe recapitulates research by Wong et al., in Cell Stem Cell (2008), "Module map of stem cell genes guides creation of epithelial cancer stem cells."

We use a gene expression dataset of primary human breast cancer tumor samples (described in Chin, K. et al, Cancer Cell, 2006), and create a module network by projecting a set of stemness regulators onto the gene expression dataset, using Genomica. A module network is a model which identifies regulatory modules from gene expression data, especially modules of co-regulated genes and their regulators. The module also identifies the conditions under which the regulation can occur.

After obtaining the module network, we visualize it using Cytoscape. Since the network is very large, we then filter it to just a subnetwork of stemness regulators and their connections, again using Cytoscape. This provides us with a visual representation of the stemness regulators as they appear projected onto a breast cancer tumor dataset.


Inputs

To complete this recipe, we will need a gene expression dataset and a list of genes which we believe to be important transcriptional regulators. In this example, we use a gene expression dataset of primary human breast cancer tumor samples, which is fully described in Chin, K. et al, Cancer Cell (2006). We also use a set of genes which are believed to be regulators of the embryonic stem cell state, called "stemness regulators". This gene set of stemness regulators can be obtained by following the recipe for completing Stepwise Linkage Analysis of Microarray Signatures (SLAMS). We will need the following datasets, which can be downloaded from the following folders:

Public > RecipeData > ExpressionData > breasttumor.preprocessed.collapsed.tab: this file contains the gene expression profile of primary human breast cancer tumor samples. The original dataset has been log-transformed, row-centered on the mean, and has had the probe IDs collapsed to HUGO Gene Symbols.

Public > RecipeData > GeneSets > stemness_regulators.geneset.tab: this file contains a list of genes which are believed to regulate genes associated with the embryonic stem cell state.

Outputs

A subnetwork of genes which regulate the transcription of embryonic stem cell-associated signature genes. This subnetwork shows the connections between regulators of this 'stemness signature'.

Recipe steps

  • Genomica
    1. Create a module network of co-regulated genes
  • Cytoscape 3
    1. Visualize the gene regulatory network
    2. Filter the network of nodes and edges to just the stemness regulators
    3. Exploring the subnetwork

  1. Launch Genomica on the normalized breast cancer gene expression dataset file (Public > RecipeData > ExpressionData > breasttumor.preprocessed.collapsed.tab) by clicking and dragging the file to the Genomica tool icon.
  2. Navigate to the following menu: Algorithms > Create a Module Network…

  3. Once the tool has loaded, change the following parameters:
    1. Under Regulation, set Maximum tree depth to 5.
    2. For Candidate regulator genes, click GenomeSpace Load….
    3. Choose the stemness regulators gene set (Public > RecipeData > GeneSets > stemness_regulators.geneset.tab), then click Select.
      NOTE: Once the list of genes is loaded, the number of candidate regulators genes will change (see image below).
  4. Click Run to create a module network.

    NOTE: It may take several minutes to learn and generate the module network.
  5. Export the resulting network to GenomeSpace using the following steps:
    1. Navigate to the following menu: GenomeSpace > Export Network to GenomeSpace…

      NOTE: A pop-up will appear indicating that you should save the file with a .ndb extension. Click OK to close the pop-up and continue with the export (see below).
    2. Choose a directory to save the file to.
    3. Give the file a name, e.g. stemness_network.ndb.
    4. Click Save As.
  6. Close Genomica and return to GenomeSpace.
  1. Launch Cytoscape from GenomeSpace by clicking on the Cytoscape icon in the tool menu, prompting the download of a cytoscape.jnlp file. Double-click this file to launch Cytoscape.
  2. Once Cytoscape has launched, it will prompt a start menu. Under the Start New Session label, choose With Empty Network.

  3. Once the Cytoscape 3 software has loaded, it will prompt the user to name their network. Feel free to change the network name, or leave the parameters as default. Click OK.
  4. To load the necessary files into Cytoscape, we will use the NDB Reader app. To install this, use the following steps:
    1. Navigate to Apps > App Manager.
    2. Search for “NDB Reader”.
    3. Click on the app and click Install to install it. Once the app is installed it allows you to load NDB files, without modifying any of the Cytoscape menu items.
  5. Navigate to the menu: File > Import > Network > GenomeSpace.
  6. Navigate to the folder with the .ndb file, stemness_network.ndb. Choose Select to load the file. This may take a few moments. Once the file is loaded, it will prompt you to import the network to a network view. Choose a network and click OK.
  7. Once the network is loaded it will ask if you want to create a view for the network. Click OK to create the network. This may take a few minutes.

This will create a network of 13,341 nodes and 117,815 edges. This is an incredibly large, dense network. It is best to filter the network before attempting to visualize it using a different Cytoscape layout, such as a force-directed layout or a degree-sorted circular layout. In the next step, we will filter the network to a more manageable size.

  1. Load the list of stemness regulators into Cytoscape using the following steps:
    1. Navigate to the menu: File > Import > Table > GenomeSpace.

    2. Choose the stemness regulators file (Public > RecipeData > GeneSets > stemness_regulators.geneset.tab). Click Select. This will bring up an import menu, allowing you to choose which names and symbols are imported into Cytoscape.
    3. Click OK to import the file.
  2. Under the Control Panel section, click the Select tab.
  3. Under the Default Filter section, click the + button to add a new filter, and choose Column Filter.
  4. Choose node.INGENESET as the attribute to filter on.
  5. Make sure the filter has the following parameters:
    1. Between 1 and 1 inclusive.
    2. Click Apply.

      NOTE: This will select the stemness regulators in the existing network. They will appear highlighted in yellow if they are a stemness regulator. Make sure not to accidentally de-select the highlighted nodes by clicking in the visualization panel. If you do accidentally de-select the nodes, you can re-select them by clicking the Apply button.
  6. In the main Cytoscape menu, click on the following menu icon. 
    This is the icon indicating the tool, New Network From Selection, All Edges. This will create a new subnetwork with just the stemness regulators and their connections. You should obtain a network of 48 nodes and 334 edges.
  • Cytoscape provides many options for displaying a network. For example:
    • A spring-embedded layout finds an optimal way to display nodes and edges by simulating nodes as objects and edges as springs connecting objects together. Cytoscape provides several variations on a spring-embedded layout. To create a spring-embedded layout, try the following:
      Layout > Edge Weighted Spring Embedded Layout
    • A circular layout arranges nodes in a circle. Layouts can use information about a node, such as the node's degree, to determine the order of nodes within the circle. To create a circular layout, try the following:
      Layout > Circular Layout
    • You can also sort a circular layout using features of the nodes, e.g. the degree or connectivity of the nodes. By creating a degree-sorted circular layout (see the results section), you can visualize all nodes and edges with minimal overlap, and can easily identify which nodes have the most or least connections.
      Layout > Degree Sorted Circle Layout
  • To control the density of the network (how far nodes are from one another), you can use the Scale function. Select Layout > Scale, then use the sliding scale bar to increase or decrease network density.
  • To change the visual style of the network, e.g., by coloring nodes or adding arrows to edges, navigate to the Style tab in the Control Panel. You can choose preset styles using a drop-down menu. You can create your own styles by clicking on the Defaults pane, then adjusting the parameters.
    For example, to adjust edge color first choose the Edge tab in the bottom part of the pane. Then click on EDGE_COLOR, choose a new color, and click OK. Some variables take numeric inputs, such as EDGE_LINE_WIDTH.

Results Interpretation

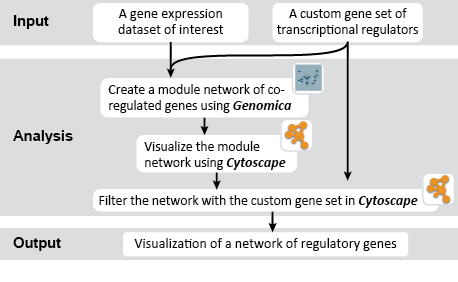
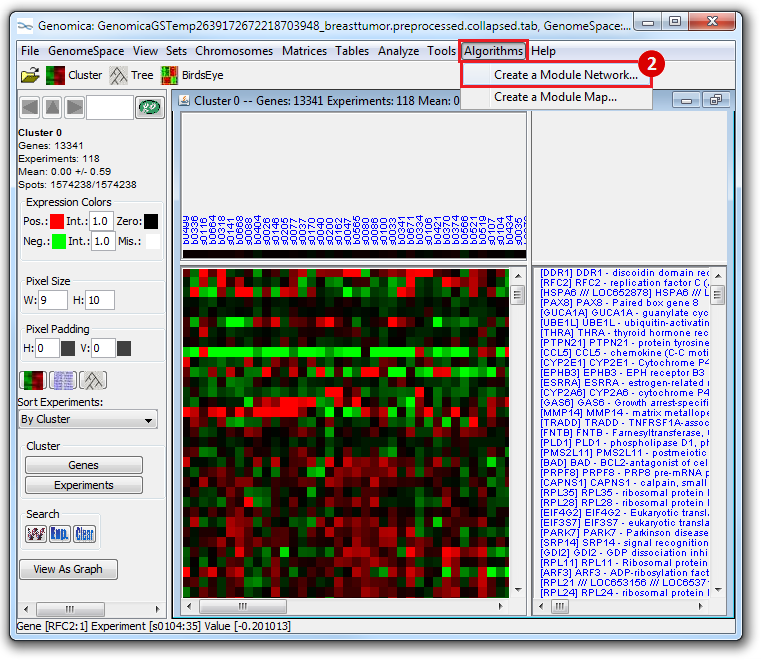
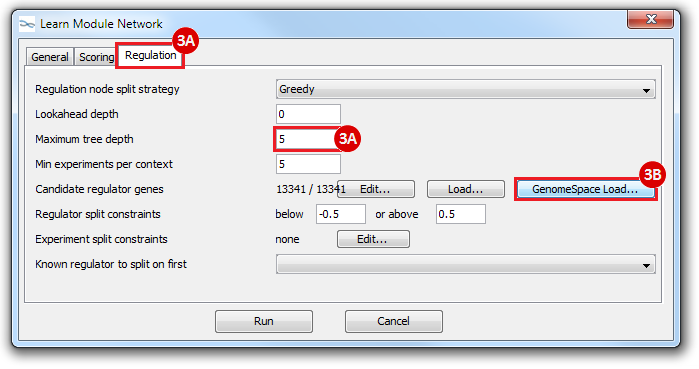
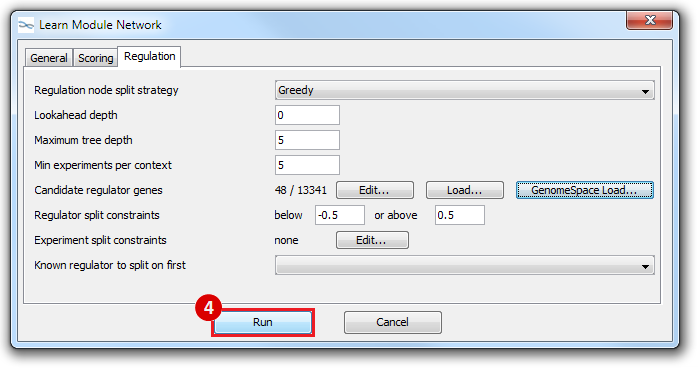
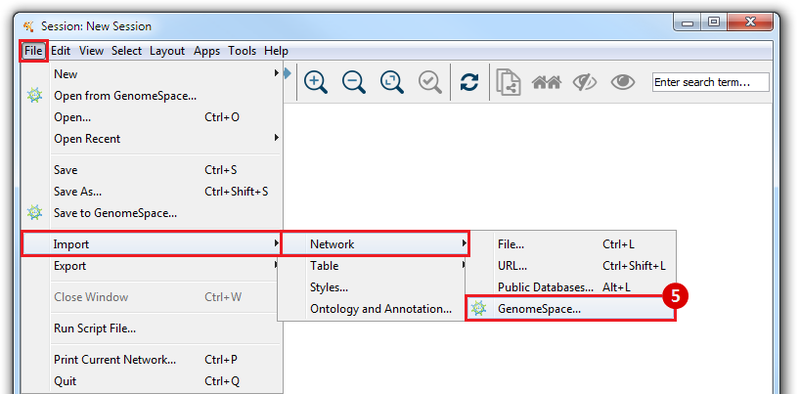
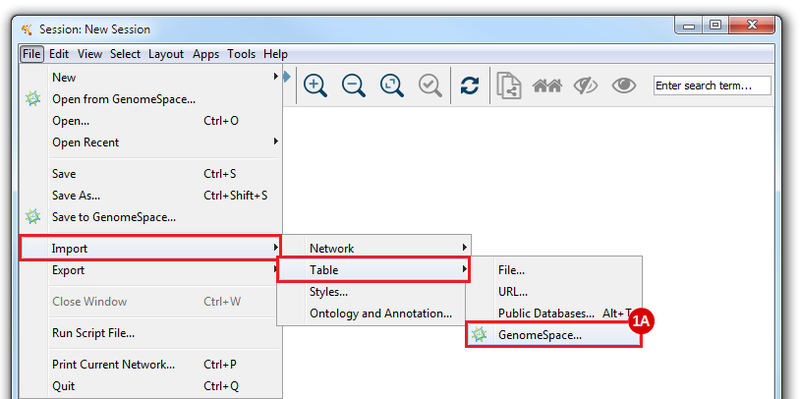
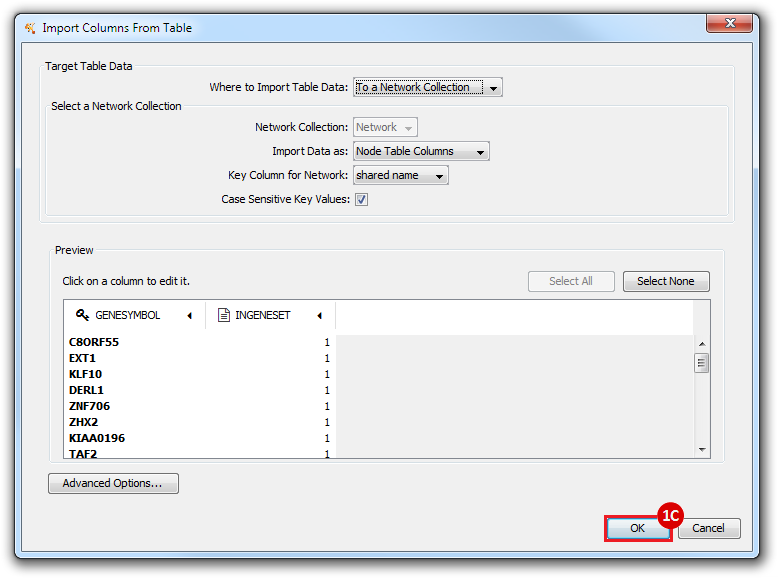
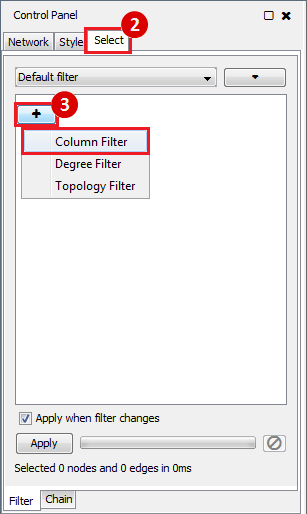
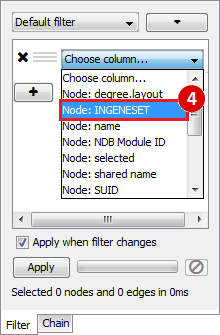
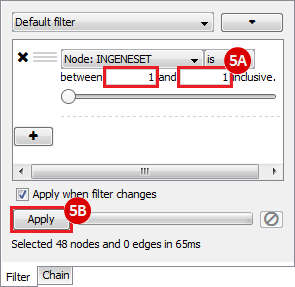
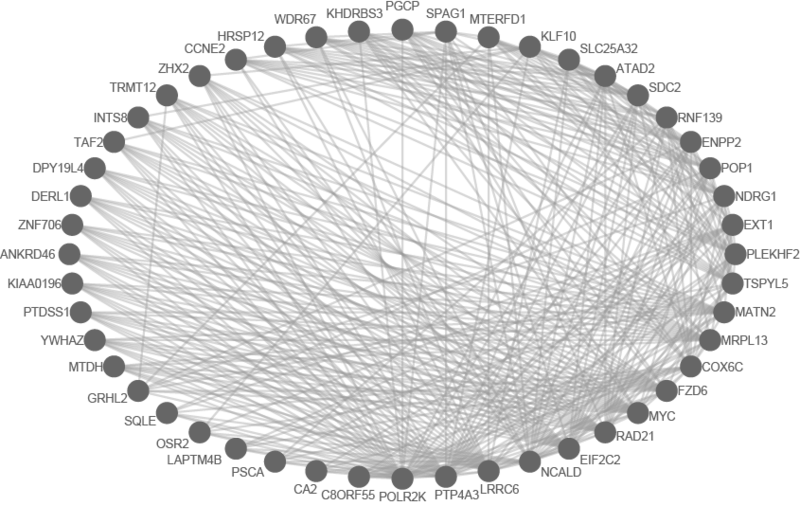
This is an example interpretation of the results from this recipe. First, we created a module network of genes that regulate the stemness signature, by projecting it onto a breast cancer tumor gene expression dataset using Genomica. We then used Cytoscape to visualize the connections between these genes, and to filter a large network down into a subnetwork of just stemness regulators.

We can see from the resulting subnetwork (see below) that, e.g. genes such as POLR2K and MYC are stemness regulators with many connections to other stemness regulators. In contrast, genes such as SQLE or PSCA have fewer connections to other stemness regulators. We can describe POLR2K and MYC as having higher 'degree', than genes such as SQLE or PSCA. These connections in the network imply that perturbing the regulation of POLR2K or MYC would have a larger effect on the embryonic stem cell expression signature (because their multiple connections allow perturbations to propagate in the network) than perturbing other genes that have fewer connections.
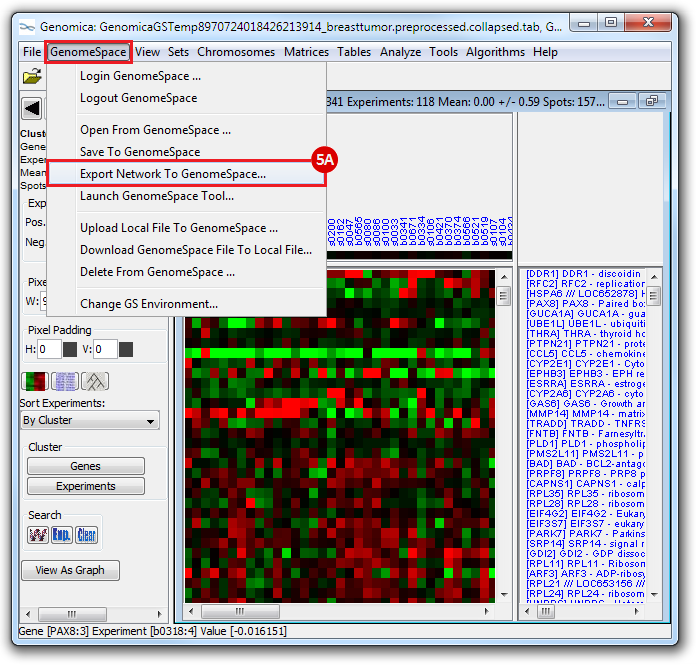

Submit a Comment

History