Gp msigdb

Identify an up- or down-regulated pathway from expression data

Added by GenomeSpaceTeam on 2015.04.21 Official logo
Last updated on over 3 years ago.


Summary

Which genes are differentially expressed in my microarray data? Are these genes enriched for certain biological pathways?

This recipe provides an outline of one method to identify known biological functions for genes that are differentially expressed between two conditions or phenotypes, using microarray data. An example use of this recipe is a case where an investigator may want to determine if a specific cancer phenotype is associated with expression of certain pathways.


Given a set of differentially expressed genes, the goal is to infer which biological functions (for example, Gene Ontology biological processes) are overrepresented in the set of reference genes found to be differentially expressed. In particular, this recipe uses a gene expression dataset which has two conditions: normal and mild hyperthermia. Then, GenePattern is used to identify differentially expressed genes, and finally MSigDB is used to identify biological functions and pathways that are enriched in the gene set.

Why differential expression analysis? We assume that most genes are not expressed all the time, but rather are expressed in specific tissues, stages of development, or under certain conditions. Genes which are expressed in one condition, such as cancerous tissue, are said to be differentially expressed when compared to normal conditions. To identify which genes change in response to specific conditions (e.g. cancer), we must filter or process the dataset to remove genes which are not informative.

Why perform functional annotation? Many analyses end with the retrieval of a gene list, e.g. gene expression analysis identifies a list of genes which are differentially expressed when comparing multiple conditions. However, often times a researcher has additional questions about the function or relatedness of genes in a gene list: Are the genes a part of the same pathway? Do the gene products interact physically? Do the gene products localize to a specific part of the cell? Are the genes only expressed during a certain stage of development? These questions, and others like them, can be answered by performing functional annotation on gene lists, to better understand the underlying connections between genes.

Inputs

To complete this recipe, we will need a gene expression dataset describing two conditions or phenotypes, such as normal conditions vs. mild hyperthermic conditions. In this example, we will use gene expression data from a study in which a human lymphoma cell line was subjected to mild hyperthermia (41°C) and compared to normal conditions (37°C).

The data needed to complete this recipe can be found on the GenomeSpace folder:

  • Public > RecipeData > ExpressionData > GSE10043 > GSE10043 ... .gct: a gene expression dataset of normal vs. mild hyperthermic human lymphoma (4 samples)
  • Public > RecipeData > ExpressionData > GSE10043 > Treatment.cls: a CLS file describing the treatment conditions for each sample

Outputs

Recipe steps

  • GenePattern
    1. Loading data
    2. Identifying differentially expressed genes
    3. Viewing differentially expressed genes
    4. Selecting the top genes
    5. Saving the file to GenomeSpace
  • MSigDB
    1. Completing functional annotation

NOTE: If you have not yet associated your GenomeSpace account with your GenePattern account, you will be asked to do so. If you do not yet have a GenePattern account, you can automatically generate a new account that will be associated with your GenomeSpace account.

  1. Open GenePattern from GenomeSpace, and navigate to the GenomeSpace tab, then navigate to the folder containing the files (Public > RecipeData > ExpressionData > GSE10043).

1. Click on the file (e.g., GSE10043GPL96_RNA_FRMAGENE_4788.gct and Treatment.cls) in GenomeSpace, then use the GenePattern context menu and click Launch on File.

OR

2. Click on the file (e.g., GSE10043GPL96_RNA_FRMAGENE_4788.gct and Treatment.cls) in GenomeSpace, then drag it to the GenePattern icon to launch.


  1. Change to the Modules tab, and search for "ComparativeMarkerSelection". Once the module is loaded, change the following parameters:
  2. input file: load the GCT file, e.g., GSE10043GPL96_RNA_FRMAGENE_4788.gct. To do this, use the GenomeSpace tab to navigate to the directory containing this file (Public > RecipeData > ExpressionData > GSE10043), then drag the file to the input box.
  3. cls file: load the CLS file, e.g., Treatment.cls. To do this, use the GenomeSpace tab to navigate to the directory containing this file (Public > RecipeData > ExpressionData > GSE10043), then drag the file to the input box.
  4. test direction: Class 1
  5. Click Run to run ComparativeMarkerSelection. This will generate an ODF file.

  1. Change to the Modules tab, and search for "ComparativeMarkerSelectionViewer". Once the module is loaded, change the following parameters:
  2. comparative marker selection file: load ODF file from the previous step, e.g., GSE10043GPL96_RNA_FRMAGENE_4788.comp.marker.odf. To do this, use the Jobs tab to view the files from the previous step, then drag the file to the input box.
  3. dataset file: load the GCT file, e.g., GSE10043GPL96_RNA_FRMAGENE_4788.gct. To do this, use the GenomeSpace tab to navigate to the directory containing your GCT file, then drag the file to the input box.
  4. Click Run to run ComparativeMarkerSelectionViewer. This will automatically launch the viewer. If the viewer does not automatically launch, you can click on the Open Visualizer button.


In this module you can view the distribution of genes in the dataset along with their scores. In our example, genes which are green (e.g. the left side of the graph) are up-regulated in mild hyperthermia when compared against normal conditions; genes that are yellow (e.g. the right side of the graph) are down-regulated in mild hyperthermia when compared against normal conditions. Genes which are significantly up- or down-regulated appear to the extreme edges of the graph; genes which are not significantly differentially expressed are in the center. The genes can be re-ordered by clicking on different parameters in the viewer; e.g. clicking on Score will re-order genes by significance. Clicking on a point in the plot will highlight that gene in the table below the graph.

  1. Change to the Modules tab, and search for "ExtractComparativeMarkerResults". Once the module is loaded, change the following parameters:
  2. comparative marker selection file: load ODF file from the previous step, e.g., GSE10043GPL96_RNA_FRMAGENE_4788.comp.marker.odf. To do this, use the Jobs tab to view the files from previous steps. Identify the output file from the ComparativeMarkerSelection step, then drag the file to the input box.
  3. dataset file: load the GCT file, e.g., GSE10043GPL96_RNA_FRMAGENE_4788.gct. To do this, use the GenomeSpace tab to navigate to the directory containing your GCT file, then drag the file to the input box.
  4. statistic: Score
  5. min: 30
  6. Click Run to run ExtractComparativeMarkerResults. This will generate two filtered files, a filtered GCT file, and a filtered TXT file.

Use one of the methods to save the file to GenomeSpace:

  1. From the job processing view, on the text file (e.g., GSE10043GPL96_RNA_FRMAGENE_4788.comp.marker.filt.txt), then choose Save to GenomeSpace. Save the file to your working directory.
  2. Change to the Jobs tab, and navigate to the output files from the previous step. Click on the file, then choose Send to GenomeSpace. Save the file to your working directory.
  3. OPTIONAL: close GenePattern.
  4. OPTIONAL: viewing the file in GenomeSpace with the preview option reveals a list of genes whose scores are ≥ 30, i.e. they are significantly up-regulated in mild hyperthermia compared to normal conditions. Note that the gene list is only of up-regulated genes (Score ≥ 30, not of down-regulated genes (Score ≤ -30).

NOTE: If you have not yet associated your GenomeSpace account with your MSigDB account, you will be asked to do so. If you do not yet have a MSigDB account, you can automatically generate a new account that will be associated with your GenomeSpace account.

Use the following steps to compute the significant overlap between the GISTIC gene set and these gene sets:

  1. Load the files into MSigDB using one of the following methods:
    1. Click on GSE10043GPL96_RNA_FRMAGENE_4788.comp.marker.filt.txt in GenomeSpace, then use the MSigDB context menu and click Launch on File
    2. Click on GSE10043GPL96_RNA_FRMAGENE_4788.comp.marker.filt.txt in GenomeSpace, then drag it to the MSigDB icon to launch
  2. Select the following check-boxes:
    1. C1: positional gene sets
    2. C2: curated gene sets
    3. C3: motif gene sets
  3. Click compute overlaps to compute the overlaps between these collections and your dataset. The resulting page will list the significance of the overlaps between the collections and your dataset. The first analysis shows the number of genes from your gene list that were found in each collection, and calculates how significant the overlap is (based on p-value). The second result lists each gene that was identified (and correctly converted) in the gene list, and the number of datasets it overlaps with.
    NOTE: Some genes may not be converted to the correct format and therefore will not be included in the calculation.
  4. Save your file to GenomeSpace by clicking on the GenomeSpace link.

See below the descriptions for the different gene sets in MSigDB:

  • C1: positional gene sets: Gene sets corresponding to each human chromosome and each cytogenetic band that has at least one gene. (Cytogenetic locations were parsed from HUGO, October 2006, and Unigene, build 197. When there were conflicts, the Unigene entry was used.) These gene sets are helpful in identifying effects related to chromosomal deletions or amplifications, dosage compensation, epigenetic silencing, and other regional effects.
  • C2: curated gene sets: Gene sets collected from various sources such as online pathway databases, publications in PubMed, and knowledge of domain experts. The gene set page for each gene set lists its source.
  • C3: motif gene sets: Gene sets that contain genes that share a cis-regulatory motif that is conserved across the human, mouse, rat, and dog genomes. The motifs are catalogued (Xie et al. 2005) and represent known or likely regulatory elements in promoters and 3'-UTRs. These gene sets make it possible to link changes in a microarray experiment to a conserved, putative cis-regulatory element.

Results Interpretation

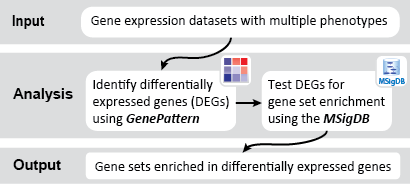
This is an example interpretation of the results from this recipe. First, we identify genes which become significantly up-regulated during mild hyperthermia, using GenePattern, resulting in a short list of genes. Next, we were interested in knowing what, if any, functional annotation these genes had - are there specific gene functions which become up-regulate in mild hyperthermia? Are the genes in this condition connected functionally?
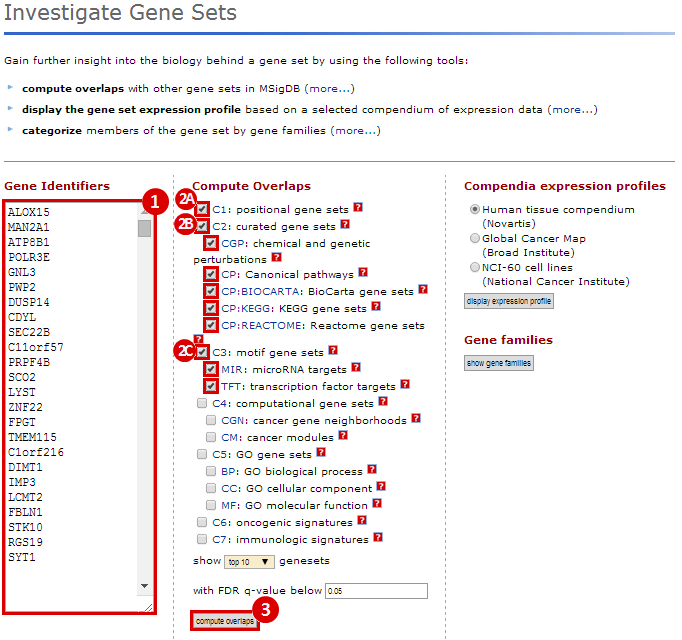
We used MSigDB to probe our dataset for functional annotation. In this case, we used only three collections: C1, C2 and C3. In this example we are most interested in knowing whether our genes are related to chromosomal deletions or amplifications (C1: positional gene set), whether our genes have functions that are reviewed in the literature (C2: curated gene set), and whether our genes share any cis-regulatory motifs (C3: motif gene set).

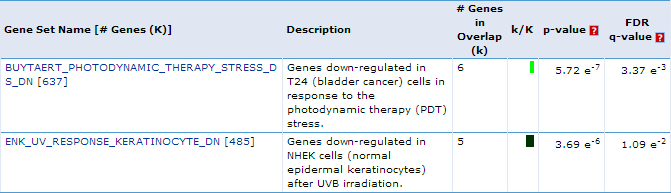
Our first result lists the gene set name and description, the number of our genes which overlap with the gene set, and measures of significance (p-values and q-values). For example, we see that 6 genes out of the 24 we submitted to MSigDB fall into the "BUYTAERT_PHOTODYNAMIC_THERAPY_STRESS_DS_DN" category, which has 637 genes total. This enrichment has a p-value = 5.75e-7. This suggests that genes which become up-regulated during mild hyperthermia are also down-regulated in bladder cancer cells in response to photodynamic therapy stress. This is just one example of a possible interpretation of these results.

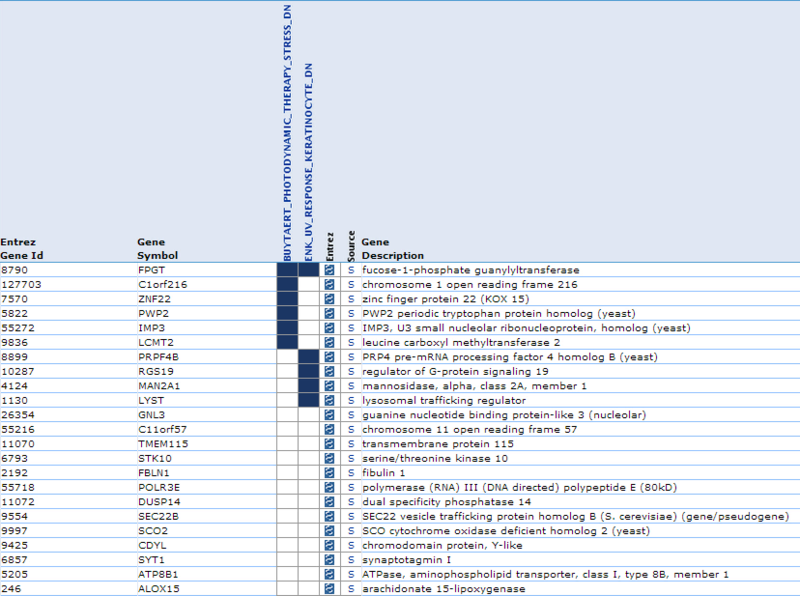
Our second result lists each gene by ID and Symbol, then highlights which of the top categories it is in. For example, lysosomal trafficking regulator (LYST) overlaps with 1 category: ENK_UV_RESPONSE_KERTINOCYTE_DN. If we examine this category, we find that LYST becomes down-regulated in keratinocytes following UVB irradiation.

These results suggest that our gene list is enriched for specific functions, which may be associated with the mild hyperthermia condition. However, the results in this example are not necessarily significant and are only a simple representation of possible results.


Submit a Comment

History