Content ucsc galaxy msigdb

Identify biological functions for genes in copy number variation regions

Added by GenomeSpaceTeam on 2015.04.21 Official logo
Last updated on almost 4 years ago.


Summary

Which genes lie in my copy number variation regions? Are these genes enriched for any biological functions or pathways?

This recipe provides a method for identifying biological functions for genes lying in copy number variation (CNV) regions. An example use of this recipe is a case where an investigator may want to examine their list of CNVs to see which genetic regions are amplified or deleted, and determine the biological functions or pathways associated with these amplified or deleted regions.


Copy number variations (CNVs) are large alterations to genomes, such as amplification or deletion of large segments of a chromosome. They can range in size from a focal aberration in a single gene to aberrations covering entire chromosome arms. These variations in the genome have been associated with different conditions, such as cancer. Many genomic analyses produce a set of genes which are assumed to be relevant to an underlying biological mechanism or phenotype. Thus, an investigator often has additional questions about the function or relatedness of these genes: Are they part of the same pathway? Do the gene products interact physically? Do the gene products localize to a specific part of the cell? Are the genes associated with certain stages of development? These questions, and others like them, can be answered by performing functional annotation of gene lists to better understand the underlying connections between genes.

In this particular example, we imagine a scenario in which an investigator identifies CNV regions that are amplified or deleted in glioblastoma multiforme (GBM) tumor samples, using a method called Genomic Identification of Significant Targets in Cancer (GISTIC, Mermel et al. (2011) Genome Biol.). Given a set of CNV regions, the goal is to infer which biological functions (e.g., metabolic and regulatory pathways, chemical perturbation signatures, etc.) are overrepresented in the set of reference genes that overlap with these regions. In particular, this recipe uses several Galaxy tools to find the overlap between CNV regions and reference genes obtained from the UCSC Table Browser. Then it uses the Molecular Signatures Database (MSigDB) to identify biological functions of the overlapped genes.

How can I use this recipe? This recipe may be modified to analyze CNV regions derived from any organism for which an annotated reference genome exists. Nor does the recipe depend on the algorithm used to identify these regions (GISTIC); any source of CNV data can be used. Once an investigator has pinpointed the CNV regions believed to be influencing their phenotype (disease state, cell type, etc.) of study he/she can use this recipe to identify functional pathways that may be affected by these copy number changes and draw closer to an understanding of the mechanisms behind these CNV effects.

Inputs

To complete this recipe, we will need a file describing the locations of CNV regions in a specific condition, and a reference genome to compare against. In this example, we use CNV regions identified in primary glioblastoma multiforme (GBM) tumor samples using the GISTIC algorithm. We will need the following datasets, which can be downloaded from the following GenomeSpace Public folder: Public > RecipeData > GenomicFeatureData.

GISTIC_CNV_deleted.txt: This file is a standard output file of the GISTIC2 tool. It lists narrow- and wide-peak regions of significant amplification in the genome, organized by chromosome, as well as start and end positions in the genome for each of these CNV regions.

GISTIC_CNV_amplified.txt: This file is a standard output file of the GISTIC2 tool. It lists narrow- and wide-peak regions of significant deletion in the genome, organized by chromosome, as well as start and end positions in the genome for each of these CNV regions.

NOTE: These data are modified files downloaded from FireBrowse, the TCGA data browser. The reference study for the TCGA glioblastoma dataset is McLendon et al. (2008) Nature.

Outputs

Recipe steps

  • UCSC Table Browser
    1. Getting reference gene annotations
  • Galaxy
    1. Loading data into Galaxy
    2. Identify genes in CNV regions
  • MSigDB
    1. Functional Annotation

  1. Launch UCSC Table Browser from GenomeSpace by clicking on the icon.
  2. Download the reference gene annotations from UCSC. For the example dataset, enter the following parameters:
    1. clade: Mammal
    2. genome: Human
    3. assembly: Feb. 2009 (GRCh37/hg19)
    4. group: Genes and Gene Predictions
    5. track: RefSeq Genes
    6. table: refGene
    7. region: genome
    8. output format: BED - browser extensible data
    9. Send output to: Select the GenomeSpace checkbox.
    10. output file: Give the output a name. For the example data, we name it hg19.RefSeq.bed.
  3. Click get output. This will take you to a new page which loads the file to GenomeSpace.

  4. On the new page, choose the Whole Gene parameter
  5. Click get BED to retrieve the file. The output file should appear in your GenomeSpace home directory.

NOTE: If you have not yet associated your GenomeSpace account with your Galaxy account, you will be asked to do so. If you do not yet have a Galaxy account, you can automatically generate a new account that will be associated with your GenomeSpace account.

Send the files to Galaxy using the following method:

  1. Open Galaxy from GenomeSpace, navigate to the Get Data tool, then click on GenomeSpace import, then navigate to your personal directory.

Make sure to load hg19.RefSeq.bed, GISTIC_CNV_amplified.txt and GISTIC_CNV_deleted.txt into Galaxy, either from your personal GenomeSpace folder, or from the GenomeSpace Public folder.


1. Click on the file(s) (e.g., hg19.RefSeq.bed) in GenomeSpace, then use the Galaxy context menu and click Launch on File.

OR

2. Click on the file(s) (e.g., hg19.RefSeq.bed) in GenomeSpace, then drag it to the Galaxy icon to launch.


  1. Click on the following link: Official GenomeSpace Galaxy Workflow: Identify Biological Functions for Genes in Copy Number Variation Regions.
  2. Click the  icon in the upper right corner to import the workflow.
  3. Click start using this workflow.
  4. Click on the workflow drop-down menu (e.g., imported: Identify Biological Fnctions for Genes in Copy Number Variation Regions), then choose Run.
  5. Load the files into the correct fields. The input fields should have annotation indicating which file should be loaded:
    1. Step 1: Input Dataset: hg19.RefSeq.bed
    2. Step 2: Input Dataset: GISTIC_CNV_deleted.txt
    3. Step 6: GenomeSpace Exporter: select a directory of your choice under the Choose Target Directory parameter
    4. Step 6: GenomeSpace Exporter: give your file a name, e.g. GISTIC_deleted_genes.txt under the filename parameter
  6. Click Run workflow.
    NOTE: The workflow will automatically save your output file to GenomeSpace.

REPEAT: In this recipe we are investigating both amplified and deleted CNV regions. To find the overlap between the reference gene annotations (hg19.refseq.bed) and the amplified CNV regions (GISTIC_CNV_amplified.txt), repeat the above steps, substituting GISTIC_CNV_amplified.txt for GISTIC_CNV_deleted.txt.

NOTE: If you have not yet associated your GenomeSpace account with your MSigDB account, you will be asked to do so. If you do not yet have a MSigDB account, you can automatically generate a new account that will be associated with your GenomeSpace account.

Use the following steps to compute the significant overlap between the GISTIC gene set and these gene sets:

  1. Load the files into MSigDB using one of the following methods:
    1. Click on GISTIC_deleted_genes.txt in GenomeSpace, then use the MSigDB context menu and click Launch on File
    2. Click on GISTIC_deleted_genes.txt in GenomeSpace, then drag it to the MSigDB icon to launch
  2. Select the following check-boxes:
    1. C1: positional gene sets
    2. C2: curated gene sets
    3. C3: motif gene sets
  3. Click compute overlaps to compute the overlaps between these collections and your dataset. The resulting page will list the significance of the overlaps between the collections and your dataset. The first analysis shows the number of genes from your gene list that were found in each collection, and calculates how significant the overlap is (based on p-value). The second result lists each gene that was identified (and correctly converted) in the gene list, and the number of datasets it overlaps with.
    NOTE: Some genes may not be converted to the correct format and therefore will not be included in the calculation.
  4. Save your file to GenomeSpace by clicking on the GenomeSpace link.

REPEAT: To complete functional enrichment analysis on the amplified CNV regions (GISTIC_CNV_amplified.txt), repeat the above steps, substituting GISTIC_CNV_amplified.txt for GISTIC_CNV_deleted.txt.

See below the descriptions for the different gene sets in MSigDB:

  • C1: positional gene sets: Gene sets corresponding to each human chromosome and each cytogenetic band that has at least one gene. (Cytogenetic locations were parsed from HUGO, October 2006, and Unigene, build 197. When there were conflicts, the Unigene entry was used.) These gene sets are helpful in identifying effects related to chromosomal deletions or amplifications, dosage compensation, epigenetic silencing, and other regional effects.
  • C2: curated gene sets: Gene sets collected from various sources such as online pathway databases, publications in PubMed, and knowledge of domain experts. The gene set page for each gene set lists its source.
  • C3: motif gene sets: Gene sets that contain genes that share a cis-regulatory motif that is conserved across the human, mouse, rat, and dog genomes. The motifs are catalogued (Xie et al. 2005) and represent known or likely regulatory elements in promoters and 3'-UTRs. These gene sets make it possible to link changes in a microarray experiment to a conserved, putative cis-regulatory element.

Results Interpretation

This is an example interpretation of the results from this Recipe. First, we identified the overlap between reference gene annotations (RefSeq format) and the copy number variation (CNV) regions using Galaxy. This results in a list of annotated genes that are located in the CNVs; there may be more genes in the CNV regions that are not properly annotated and therefore were missed in the analysis. In this example, we find roughly 1300 genes that are amplified in CNV regions, and roughly 8800 genes that are deleted in CNV regions. Next, we were interested in knowing what, if any, functional annotation these genes had - are there specific gene functions being duplicated in CNV regions? Are the gene products in these regions connected functionally?
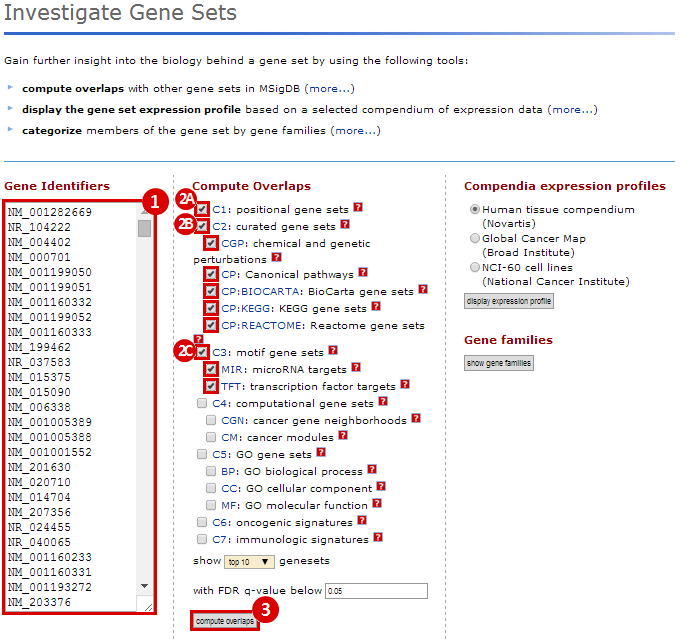
We used MSigDB to probe our dataset for functional annotation. In this case, we used only three collections: C1, C2 and C3. In this example we are most interested in knowing whether our genes are related to chromosomal deletions or amplifications (C1: positional gene set), whether our genes have functions that are reviewed in the literature (C2: curated gene set), and whether our genes share any cis-regulatory motifs (C3: motif gene set).

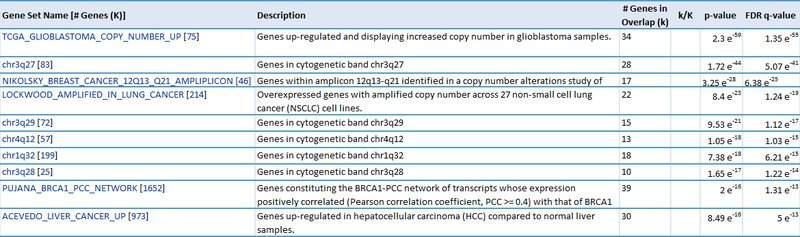
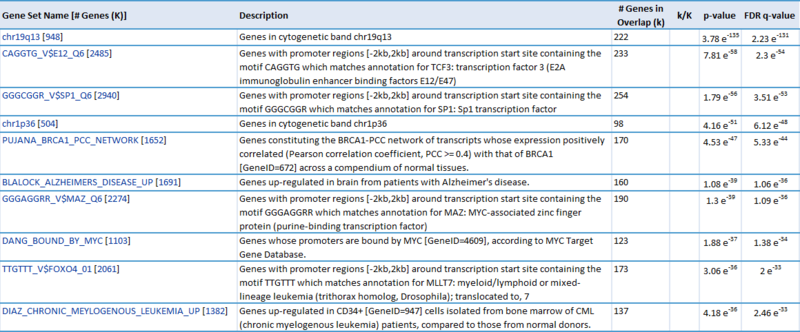
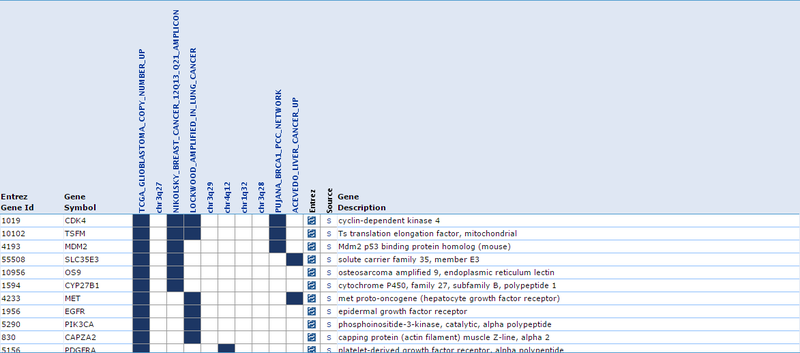
Our first result lists the gene set name and description, the number of our genes which overlap with the gene set, and measures of significance (p-values and q-values). For example, we see that 28 genes out of the ~1300 amplified genes fall into the "chr3q27" category, which has 83 genes total. This result is significant (p-value = 1.72e-44). This suggests that the CNV regions associated with glioblastoma are enriched for genes duplicated on chromosomal region chr3q27. Similarly, 222 genes out of the ~8800 deleted genes fall into the "chr19q13" category, suggesting that glioblastoma is associated with deletions in this chromosomal region (p = 3.78e-135). This is just one example of a possible interpretation of these results.

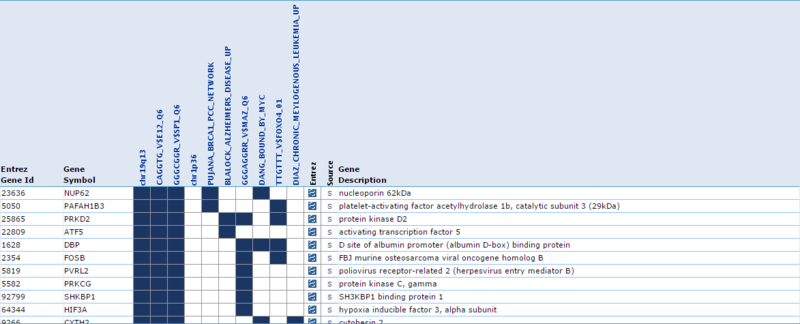
Our second result lists each gene by ID and Symbol, then highlights which of the top categories it is in. For example, the amplified gene CDK4 overlaps with 4 categories: TCGA_GLIOBLASTOMA_COPY_NUMBER_UP, NIKOLSKY_BREAST_CANCER_12Q13_Q21_AMPLICON, LOCKWOOD_AMPLIFIED_IN_LUNG_CANCER, and PUJANA_BRCA1_PCC_NETWORK. If we examine the categories, they suggest that CDK4 is amplified in glioblastoma, breast cancer, and lung cancer, and that CDK4 is a part of the BRCA1 regulatory network. Similarly, when we examine the deleted gene NUP62, we observe that it overlaps with 5 categories: chr19q13, CAGGTG_V$E12_Q6, GGGCGGR_V$SP1_Q6, PUJANA_BRCA1_PCC_NETWORK, and DANG_BOUND_BY_MYC. This suggests that NUP62 is in the chr19q13 chromosomal region, that it contains motifs CAGGTG and GGGCGGR, and that it is associated with the BRCA regulatory network and its promoter is bound by Myc.

These results suggest that our gene list is enriched for specific chromosomal regions and specific promoter region motifs, among other functional annotations. This suggests that functionally related genes are being duplicated in CNV regions in a cancer phenotype. However, the results in this example are not necessarily significant and are only a simple representation of possible results.
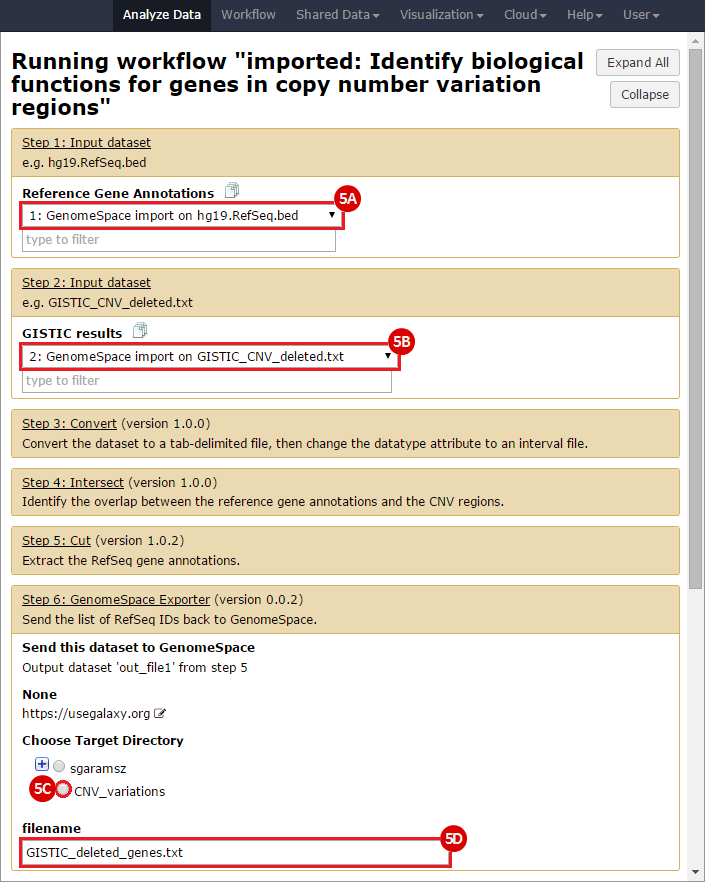

Submit a Comment

History