Build and visualize a module network using putative aberrant regions and expression data |
Added by GenomeSpaceTeam on 2015.04.21
Last updated on over 3 years ago.
Which genes lie in my copy number variation regions? Are there any sets of co-regulated genes in these aberrant regions?
This recipe provides a method for identifying and visualizing a network of co-regulated genes that are associated with aberrant regions identified by single nucleotide polymorphism (SNP) arrays. An example use of this recipe is a case where an investigator may want to find which genes are located in regions that exhibit significant changes (e.g. amplification or deletion) in cancer cells.
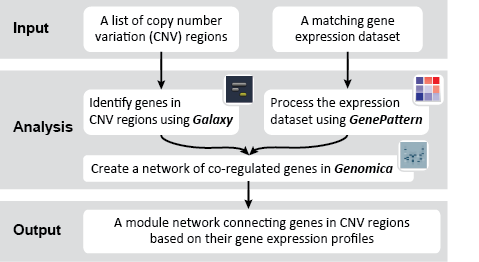
This recipe provides one method for identifying and visualizing aberrant regions in Diffuse Large B-Cell Lymphoma (DLBCL) cancer cells. This recipe uses copy-number variation (CNV) data from SNP arrays, and evaluates the expression of aberrant regions using a microarray dataset. Regions that are significantly changed (e.g., amplified or deleted) in cancer cells are defined by the GISTIC algorithm. In particular, this recipe makes use of several Galaxy tools to find the overlap between the aberrant regions and reference genes, and uses GenePattern to process the microarray dataset. Genomica is used to find module networks of co-regulated genes associated with these aberrant regions. A module network is a model which identifies regulatory modules from gene expression data, especially modules of co-regulated genes and their regulators. The module also identifies the conditions under which the regulation can occur.
Why analyze copy number variation regions? Copy number variations (CNVs) are large alterations to genomes, such as duplication or deletion of large segments of a chromosome. These variations in the genome have been associated with different conditions, such as cancer. In this recipe, we explore the scenario in which CNVs are elevated in a cancer cell line, and our goal is to determine the function of these duplicated genes.
To complete this recipe, we will need a file describing the locations of CNV regions in a specific condition. In this example, we use CNV regions identified in DLBCL cancer cell lines using the GISTIC algorithm, which identifies regions of a genome that are significantly amplified or deleted across a set of samples. For this particular recipe, the GISTIC file will need to have the .BED extension. In addition, we will need the accompanying gene expression dataset to evaluate the expression of these aberrant genes. We will need the following datasets, which can be downloaded from the following GenomeSpace Public folders:
Public
> RecipeData
> GenomicFeatureData
> GISTIC_regions.bed
: This file lists CNV regions in the genome, organized by chromosome, and listing start and end positions in the genome for each CNV region.
Public
> RecipeData
> ExpressionData
> mrna_orig.gct
: This is a GCT file of the microarray data which accompanies the DLBCL SNP array data.
NOTE: If you have not yet associated your GenomeSpace account with your Galaxy account, you will be asked to do so. If you do not yet have a Galaxy account, you can automatically generate a new account that will be associated with your GenomeSpace account.
Get Data
tool, then click on GenomeSpace import from file browser
, then navigate to the example data file: Public
> RecipeData
> GenomicFeatureData
> GISTIC_regions.bed
(or to your personal directory)GISTIC_regions.bed
is loaded into Galaxy, click the pencil icon to edit the attributes. Change the attributes to the following parameters:
Database
: Human Feb. 2009 (GRCh37/hg19) (hg19)chrom
, start
, and end
attributes are pointing to the correct columns in the GISTIC file.Tool: Galaxy
1. Click on the file (e.g., GISTIC_regions.bed
) in GenomeSpace, then use the Galaxy context menu and click Launch on File
.
OR
2.Click on the file (e.g., GISTIC_regions.bed
) in GenomeSpace, then drag it to the Galaxy icon to launch.
We will use the UCSC Main
tool to obtain a reference genome from the UCSC Table Browser, through Galaxy.
Get Data > UCSC Main
clade
: mammalgenome
: Humanassembly
: Feb. 2009 (GRCh37/hg19)group
: Genes and Gene Predictionstrack
: UCSC genestable
: knownGeneregion
: genomeoutput format
: selected fields from primary and related tablessend to
: Galaxy
get output
. This will load a new page from which you can select specific annotations. Change the following parameters:
Linked Tables
, make sure hg19: knownToLocusLink
is checked.allow selection from checked tables
to update the page.Select Fields from hg19.knownGene
, make sure the following parameters are checked:
chrom
: Reference sequence chromosome or scaffoldcdsStart
: Coding region startcdsEnd
: Coding region endhg19.knownToLocusLink fields
, make sure the following parameters are checked:
value
: Entrez Gene ID (formerly known as LocusLink)done with selection
to load the final output page.
Send query to Galaxy
to run the job. This will generate a new file of reference gene annotations.Datatype
tab, set New Type
: interval OR bedAttributes
tab, set Chrom column
: 1Start column
: 2End column
: 3Name/Identifier column (click box & select)
parameter, and set it equal to 4. This will set the identifier values to the Entrez IDs.Save
to save the new attributes. It may take some time to save the new attributes We will use the Operate on Genomic Intervals
tool to find the overlap between the reference gene annotations and the CNV regions. In this recipe, we set the cut-off for an overlapping region to be at least 1 base pair. This tools uses the original BED file and the reference gene annotations.
Operate on Genomic Intervals > Intersect
Return
: Overlapping intervalsof
: the reference genome annotations, e.g., from the UCSC Main on Human: knownGene (genome) job.that intersect
: the GenomeSpace import on GISTIC_regions.bed
for at least
: 1Execute
to submit your job. This will generate a processed BED file.
We will use the Text Manipulation
tool to select a specific row or column of our processed BED file. This tool uses the processed BED file.
Note: There are two versions of a "cut" tool in Galaxy. In this example we use the first version, also known as "Cut columns from a table". The second, similarly named tool is called "Cut columns from a table (cut)". Please make sure to match the parameters described in the screenshots to the tool parameters you see in Galaxy.
Text Manipulation > Cut
Cut columns
: c4Delimited by
: tabFrom
: the intersect output (e.g., the intersect of GISTIC_regions.bed
and the reference gene annotations).Execute
to submit your job. This will generate a processed TXT file. However, this file has duplicate entries which will be removed in the next step.
We will use the Join, Subtract and Group
tool to remove duplicate entries from our dataset. The goal is to extract only the unique Entrez ID gene annotations for the genes in the CNV region.
Join, Subtract and Group > Group
Select data
: the list of genes from the Cut jobGroup by column
: column 1Execute
to submit your job. This will generate a processed TXT file of only unique Entrez IDs.
We will use the Send Data
tool to send our newly created TXT file back to GenomeSpace, so that we can later use the reference gene annotations in a different program.
Send Data > GenomeSpace Exporter
Send this dataset to GenomeSpace
: the list of Entrez Gene IDs with duplicates removedChoose target directory
: navigate to your GenomeSpace directoryfilename
: choose a filename, e.g., GISTIC_genes.txt
Execute
to submit your job. This will send your data to GenomeSpace.
NOTE: If you have not yet associated your GenomeSpace account with your GenePattern account, you will be asked to do so. If you do not yet have a GenePattern account, you can automatically generate a new account that will be associated with your GenomeSpace account.
Public
> RecipeData
> ExpressionData
> mrna_orig.gct
(or to your personal directory).Tool: GenePattern
Click on the file (e.g., mrna_orig.gct
) in GenomeSpace, then use the GenePattern context menu and click Launch on File
.
OR
Click on the file (e.g., mrna_orig.gct
) in GenomeSpace, then drag it to the GenePattern icon to launch.
We will use the PreprocessDataset
module to filter the expression dataset and normalize the data. This module uses the GCT file, mrna_orig.gct
.
Modules
tab, and search for "PreprocessDataset".input filename
: load the GCT file, e.g., mrna_orig.gct
. To do this, navigate to the GenomeSpace
tab, and navigating to the folder containing the GCT file. Load the file into the input filename
parameter by clicking and dragging the file to the input filename
input box.floor
: 0min fold change
: 1min delta
: 0row normalization
: yesPreprocessDataset
. This will generate a processed GCT file.Save the mrna_orig.preprocessed.gct
file to GenomeSpace using one of the following methods.
mrna_orig.preprocessed.gct
), then choose Save to GenomeSpace
. Save the file to your folder.Tool: GenePattern
Modules and Pipeline
start page, navigate to Jobs
. Click on the file, then choose Send to GenomeSpace
. Save the file to your folder.We will use Genomica to create and visualize a "module network" of co-regulated genes. This will illustrate similarities in expression of the genes associated with aberrant regions in cancer cells.
NOTE: Genomica requires a Java security exception. In order to open the Genomica JNLP, add https://genie.weizmann.ac.il to your Java exception site list. For more information on how to do so, go HERE
.jnlp
file. Double-click the file to launch Genomica.GenomeSpace > Open From GenomeSpace...
. This will generate a small window with a file menu. Navigate to the location of the mrna_orig.preprocessed.gct
file.Select
to load the file. It may take several seconds to load the file. When the file is loaded, a heatmap should appear.To create a module expression network in Genomica, we use the Create Module Network
algorithm. A module network is a model which identifies regulatory modules from gene expression data, especially modules of co-regulated genes and their regulators. The module also identifies the conditions under which the regulation can occur.
Algorithms > Create a Module Network...
.General
tab, set Max number of iterations
to 5.Regulation
tab, load the GISTIC_genes.txt
file into the Candidate regulator genes
parameter. To do this, click the GenomeSpace Load...
button, navigate to the folder containing your GISTIC_genes.txt
file, click it, and click Select
.Run
to run the algorithm. A new dialog box will appear, showing the progress of the algorithm. This may take several minutes to run.
NOTE: Depending on how many modules you are interested in findings, you can change the Max number of modules
parameter to a different number. In this example, we limit our regulator gene set to the 95 genes extracted using Galaxy. We then look for a maximum of 50 modules whose gene expression can be categorized by the expression of these candidate regulator genes. To save time, we only run 5 iterations to identify modules.
When the algorithm completes running, you can view the different modules that it produces. There are different ways to view the data; we can use these visualizations to browse through the data and identify modules of differentially expressed genes.
Cluster
view, then under the Sort Experiments
option, choose By Descendents
from the drop-down menu.View > Cluster
, and make sure Experiments Tree
is checked.Cluster
view, then click the ▲
button in the left-side menu to move up-ward in the regulation program.This is an example interpretation of the results from this recipe.
First, we identified the overlap between reference gene annotations (Entrez ID format) and the aberrant regions in cancer cells, using Galaxy. This resulted in a list of annotated genes that are located in the aberrant regions associated with cancer. In this example, we find roughly ~650 genes. Independently, we processed and normalized the microarray dataset so that the expression of genes associated with the aberrant regions could be observed. In this example, the microarray has roughly ~4000 genes. Using Genomica, we view the expression of the genes identified in aberrant regions, and try to find modules of similarly regulated genes, based on the list of candidate regulator genes from Galaxy. There are roughly ~100 genes which Galaxy identified which were also in the microarray; these ~100 genes are our 'candidate regulator genes'.
To view the regulatory program of a specific module, click on a part of the cluster heatmap and then use the triangle button in the left-side menu to view up-stream regulators of expression. In this example, we view one of the clusters and observe the regulatory program:
In the left panel is the BirdsEye
view, which displays all the modules found by the algorithm. Each module is separated by horizontal yellow lines, and the splits within a module are separated by vertical yellow lines. Splits indicate that regulation of an up-stream gene changes from one group of arrays to the next. In this example, the module we are examining is highlighted in blue; note that only one part of the module is highlighted (we are examining only a few splits within the module). The right panel is the Cluster
view of the microarray, organized according to the BirdsEye
view. For example, the clusters we are examining (highlighted in blue) have been moved to the left side of the Cluster
view, even though they are the rightmost clusters in the BirdsEye
view. The top part of the second panel indicates the gene regulation program; the middle indicates the arrays grouped according to expression, and the bottom indicates the actual expression itself (as a microarray).
The regulation program illustrates which genes are thought to be associated with the regulation observed in the microarrays. Gene names are displayed along arrows indicating how the gene is regulated in different modules. Arrays are sorted to the left and right of the split by a boolean answer to the question, "Is GeneA up-regulated?" Arrays which are up-regulated for a gene will fall on the righthand side; all other arrays fall on the lefthand side. Let's examine the regulation program more closely. We see that Gene 5205 is up-regulated in Groups 2, 3, and 4, but not in Group 1. Gene 825 is up-regulated in Group 4, but not Groups 2 and 3. Finally, Gene 1455 is up-regulated in Group 3, but not 2. Therefore, we could say that Group 2 is associated with up-regulation of Gene 5205, but no up-regulation of Genes 825 or 1455.
However, the results in this example are just one interpretation and are only a simple representation of possible results.
Hi AlexTall, thank you for contacting us! I just gave this a try and was not able to replicate the issue. For me there is a small pop-up window that gives me access to my GenomeSpace files. Please email us at gs-help[at]broadinstitute.org, so that we can open a ticket and help troubleshoot this issue.
Hi everyone I have some trouble in “10: Loading files into Genomica “. When I launched Genomica and wanted to “Open From GenomeSpace” new window does not appear to choose "mrna_orig.preprocessed.gct" file form it. Can anyone help me please?