Identify enriched biological functions in single-nucleotide polymorphisms (SNPs) |
Added by GenomeSpaceTeam on 2015.05.06
Last updated on over 3 years ago.
How are SNP-related genes regulated in an expression dataset? Are these genes enriched for particular biological functions?
This recipe provides one method for identifying enriched biological functions in single-nucleotide polymorphisms (SNPs). An example use of this recipe is a case where an investigator may complete a genome-wide association study (GWAS) and wants to know the SNPs that are associated with certain genomic coordinates, in order to determine which genes have particular biological functions.
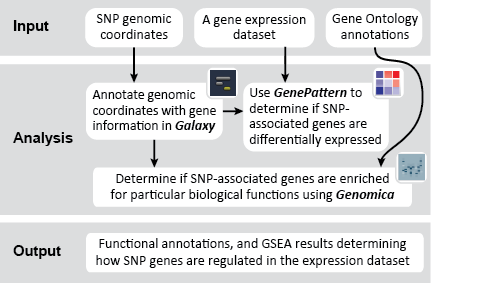
In this particular example, we imagine a scenario in which an investigator completes a GWAS study, obtaining a list of genomic coordinates that are associated with SNPs. However, simply knowing these genomic coordinates is not always informative; the investigator is also interested in knowing which genes lie in these regions, and what kinds of biological functions these genes may have. In this particular example, we are interested in answering two questions:
To answer the first question, we will find Gene Ontology functional annotations using Genomica. To answer the second question, we will use the Gene Set Enrichment Analysis (GSEA) module in GenePattern, comparing the SNP-associated genes to a gene expression dataset from a study of epithelial cancer stem cells. This study evaluated the ability of oncogenes to activate an embryonic stem cell program in differentiated adult tumor cells, by transforming human keratinocytes into squamous cell carcinomas using oncogenic Ras and IκBα, plus one of three genes: c-Myc, E2F3, and GFP (Wong et al. 2009. Cell Stem Cell). Comparisons between these three genes showed that c-Myc could re-activate the embroynic stem cell program. Comparing the SNPs to this gene expression dataset can determine whether this set of SNP-associated genes are differentially regulated in c-Myc samples, when compared to other genes such as GFP and E2F3.
To complete this recipe, we will first need a file describing the genomic coordinates of SNPs, as well as a gene expression dataset against which to compare genes associated with SNPs. In addition, in order to complete functional annotation in Genomica, we will need special files of the human Gene Ontology (GO) annotations. We will need the following datasets, which can be downloaded from the following GenomeSpace Public folder:
Public
> RecipeData
> GenomicFeatureData
> SNPanalysis_data.bed
: A file of the genomic coordinates of SNPs from a GWAS study. The SNPs are listed in a BED file format, with a chromosome annotation and starting and ending positions for coding regions which have SNPs.
Gene Expression Dataset:
Public
> RecipeData
> ExpressionData
> GSE10423
> GSE10423.gct
: A gene expression dataset of human keratinocytes transformed by Ras, IκBα, and one of three genes: c-Myc, E2F3, and GFP. The file is available in GenePattern's GCT format.
Public
> RecipeData
> ExpressionData
> GSE10423
> GSE10423.cls
: A class file containing assignments for all the samples in the GCT file (+Myc or -Myc). The file is in GenePattern CLS format.
Public
> RecipeData
> ExpressionData
> GSE10423
> GSE10423.chip
: A file containing the microarray chip information for the this gene expression dataset.
Genomica Database Files:
Public
> RecipeData
> Tool_Genomica
> human_GO.gxa
: A file containing the annotations of genes by pathways, functions, and biological processes from the Gene Ontology.
Public
> RecipeData
> Tool_Genomica
> Human_RefSeq_skeleton_expression.tab
: A file containing RefSeq IDs for parsing in Genomica.
We will load the file containing SNPs into Galaxy. Then, we will use a pre-built GenomeSpace workflow to process the dataset, mapping the SNPs to reference gene annotations and extracting the gene IDs in two formats (Gene Symbol and RefSeq ID). Finally, we will send the gene IDs back to GenomeSpace for additional analysis.
NOTE: If you have not yet associated your GenomeSpace account with your Galaxy account, you will be asked to do so. If you do not yet have a Galaxy account, you can automatically generate a new account that will be associated with your GenomeSpace account.
Get Data > GenomeSpace import
.SNPanalysis_data.bed
file, which can be found under the following directory: Public
> RecipeData
> GenomicFeatureData
.Send to Galaxy
.We will use the UCSC Main tool to obtain a reference genome from the UCSC Table Browser, through Galaxy.
Get Data > UCSC Main
clade
: Mammalgenome
: Humanassembly
: Feb. 2009 (GRCh37/hg19)group
: Genes and Gene Predictionstrack
: UCSC genestable
: knownGeneregion
: genomeoutput format
: selected fields from primary and related tablessend to
: Galaxyget output
. This will load a new page from which you can select specific annotations.
Linked Tables
, make sure the hg19: kgXref is checked.allow selection from checked tables
to update the page, then change the following parameters:
Select Fields from hg19.knownGene
, make sure the following parameters are checked:
chrom: Reference sequence chromosome or scaffold
cdsStart: Coding region start
cdsEnd: Coding region end
hg19.kgXref
, make sure the following parameters are checked:
geneSymbol
: Gene Symbolrefseq
: RefSeq IDdone with selection
to load the final output page.
Send query to Galaxy
to run the job. This will generate a new file of reference gene annotations.We will use a pre-built GenomeSpace workflow to identify genes in the CNV regions, and to extract the gene IDs.
start using this workflow
.Run
.
Step 1: Input Dataset (UCSC Reference Genome Annotations)
: UCSC Main on Human: knownGene (genome)Step 2: Input Dataset (SNP Genomic Coordinates, e.g. SNPAnalysis_data.bed)
: GenomeSpace import on SNPanalysis_data.bedRun
workflow.Send Data > GenomeSpace Exporter
. Change the following parameters:
Send this dataset to GenomeSpace
: 4: Cut on data 3
, the output file of Gene Symbols, e.g. "ACTB".Choose Target Directory
: choose the directory to save the file infilename
: SNPanalysis_GeneSymbol.grp
Execute
.
Send Data > GenomeSpace Exporter
. Change the following parameters:
Send this dataset to GenomeSpace
: 5: Cut on data 3
the output file of RefSeq IDs, e.g. "NM_123456789", etc.Choose Target Directory
: choose the directory to save the file infilename
: SNPanalysis_RefSeq.gse
Execute
.We will use the Gene Set Enrichment Analysis (GSEA) module to determine whether the SNP-associated genes are up- or down-regulated in biological conditions such as cancer. We will use the SNP-associated genes as a custom 'gene set' to evaluate its enrichment on a gene expression dataset of human keratinocytes transformed into squamous cell carcinomas. This module uses the GCT file and the CLS file, as well as the list of Gene Symbols from the SNP analysis in Galaxy.
NOTE: If you have not yet associated your GenomeSpace account with your GenePattern account, you will be asked to do so. If you do not yet have a GenePattern account, you can automatically generate a new account that will be associated with your GenomeSpace account.
Modules
tab, and search for "GSEA". Change to the GenomeSpace
tab to navigate to the directory containing the GSE10423 gene expression dataset files. Once the module is loaded, change the following parameters:
expression dataset
: GSE10423.gct
, found in the following directory: Public
> RecipeData
> ExpressionData
> GSE10423
.gene sets database file
: SNPanalysis_GeneSymbol.grp
phenotype labels
: GSE10423.cls
, found in the following directory: Public
> RecipeData
> ExpressionData
> GSE10423
.chip platform file
:
Upload your own file
button, which will create a new drag-and-drop input box.GSE10423.chip
file, found in the following directory: Public
> RecipeData
> ExpressionData
> GSE10423
.GSE10423.zip
), and choose Save to GenomeSpace
.Save
.Expand Archive
. This should create a new folder in GenomeSpace that you can access, containing all the GSEA results.We will use Genomica to determine whether the SNP-associated genes are enriched for particular biological functions by analyzing multiple gene sets.
First, we must save files to the local drive in order for Genomica to run the multiple gene set analysis.
Public
> RecipeData
> Tool_Genomica
> human_GO.gxa
Public
> RecipeData
> Tool_Genomica
> Human_RefSeq_skeleton_expression.tab
human_GO.gxa
and Human_RefSeq_skeleton.tab
, in this folder.
human_GO.gxa
on a Windows computer will be located in: C:/Users/USERNAME/Genomica/human_GO.gxa
human_GO.gxa
on a Mac computer will be located in: /Users/USERNAME/Genomica/human_GO.gxa
Next, we will complete an enrichment analysis by comparing multiple gene sets in Genomica.
SNPanalysis_RefSeq.gse
.Analyze Gene Sets
. Change the following parameters:
Sets to Analyze
, choose Human GO
.Sets to Find Enrichment For
, choose the SNP_analysis_RefSeq.gse
file. It may have additional text and numbers in front of the file name due to the Genomica import.Analyze
. The output should be a table of gene functional annotation enrichments.Analyze
button, try making the window larger by clicking and dragging the bottom edge of the window downward.
Analyze
button that appears for Windows users.
This is an example interpretation of the results from this recipe. First, we performed Gene Set Enrichment Analysis (GSEA) to determine if the SNP-associated genes are up- or down-regulated in a biological condition such as cancer. To interpret our GSEA results, we navigate to the un-zipped file of GSEA results.
This folder contains the results of the GSEA, including: tables of results; plots such as enrichment plots, heatmaps, butterfly plots, distribution plots, and correlation profiles; and HTML pages designed to display and explain the accompanying results. Clicking on the index.html
file will bring up a local HTML webpage linking to the remaining results, in an easy-to-navigate format. In this example, the results indicate that our SNP-associated gene set was up-regulated in the skin tumor phenotype, but these results are not significant. For more help interpreting the results from GSEA analyses, visit the GSEA User Guide page for interpreting GSEA results.
Next, we used Genomica to determine whether SNP-associated genes are enriched for particular biological functions using multiple gene set analysis. The results from this analysis are (1) a table of significantly enriched GO terms, and (2) a graphical representation of the enrichment for each GO term in the gene set being analyzed.
The Genomica results suggest that there is significant overlap between the SNP-associated gene set and GO terms like, e.g., "regulation of nuclear mRNA splicing, via spliceosome" and "negative regulation of mRNA processing". These GO term enrichment results have high p-values (see table above, column 4), and have a large amount of overlap between the SNP-associate gene set and the GO term gene set (see graphic below). The significance of this possible result would need further confirmation.