Preprocess and quality check RNA-seq data |
Added by GenomeSpaceTeam on 2015.04.21
Last updated on over 3 years ago.
What is the quality of my RNA-seq reads? Are my RNA-seq reads of good quality or are there artifacts and errors I should remove and/or be aware of?
This recipe provides an outline of one method to preprocess and determine the quality of RNA-seq libraries. An example use of this recipe is a case where an investigator has completed sequencing of samples, and wants to evaluate and check the quality of the sequencing results before going through the time-consuming process of aligning the reads against a genome.
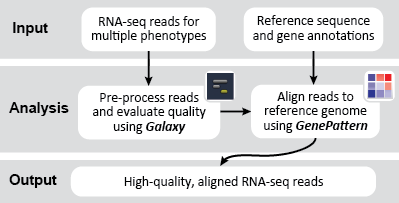
Given a set of raw RNA-seq reads, the goal is to align the reads to a reference genome and assess the quality of the read alignments by obtaining metrics such as depth of coverage, rRNA contamination, continuity of coverage, and GC bias. The purpose of this recipe is to process raw RNA-seq reads prior to aligning them against a reference genome. In particular, this recipe uses a dataset which has RNA-seq reads contaminated with adapter sequences. First we identify and remove adapter sequences using Galaxy, then we process the data and align it to a reference genome using GenePattern.
Why remove adapter sequences? Adapter sequences are short pieces of DNA with known sequence, which are used to link DNA molecules together. In particular, these are used to link an unknown DNA sequence to a sequencing primer, in order to sequence the unknown DNA strand. Most of the time adapter sequences are removed during pre-processing when data is sent to a researcher; however, sometimes some adapter sequences remain. It is important to remove these sequences before aligning reads to a genome.
To complete this recipe, we will need raw RNA-seq reads that we will process and align to a reference genome. In this example, we will use RNA-seq data of a S. cerevisiae wild-type strain. In this recipe we will focus on pre-processing and aligning reads. We will need the following datasets, which can be downloaded from the following GenomeSpace Public folder: Public > RecipeData
.
SequenceData
> RNA-Seq.fastq
: This is an RNA-seq file containing reads from the wild-type strain of S. cerevisiae.
SequenceData
> SacCer3.fa
: This is a FASTA file containing sequences for a reference genome for S. cerevisiae.
GenomicFeatureData
> SacCer3.gtf
: This is a GTF file which contains reference gene annotations for the S. cerevisiae genome.
NOTE: If you have not yet associated your GenomeSpace account with your Galaxy account, you will be asked to do so. If you do not yet have a Galaxy account, you can automatically generate a new account that will be associated with your GenomeSpace account.
Get Data
tool, then click on GenomeSpace import
, then navigate to your personal directory (eg. SequenceData
> RNA-Seq.fastq
)Tool: Galaxy
1. Click on the file (e.g., RNA-Seq.fastq
) in GenomeSpace, then use the Galaxy context menu and click Launch on File
.
OR
2. Click on the file (e.g., RNA-Seq.fastq
) in GenomeSpace, then drag it to the Galaxy icon to launch.
We will use the FastQC
tool to evaluate the quality of our FASTQ files. In this recipe, we use the FastQC
tool to identify adapter sequences which are contaminated in the RNA-seq dataset. This tool uses the two FASTQ files.
NGS: QC and manipulation > FastQC:Read Quality reports
Short read data from your current history
: Your fastq file (e.g., RNA-Seq.fastq
)1: GenomeSpace importer on RNA-Seq.fastq
Execute
button to submit your job. This will generate a FastQC
report as an HTML document.
There are various ways to interpret the FastQC
report. In this recipe, we are most interested in identifying adapter sequences which we believe are contaminating our RNA-seq data.
FastQC
report by clicking on the eye icon next to the job titled FastQC on data 1: RawData
.Overrepresented
sequences link. You should see a table similar to the one below:
Sequence | Count | Percentage | Possible Source |
---|---|---|---|
GATCGGAAGAGCGGTTCAGCAG... | 8122 | 8.122 | Illumina Paired End PCR Primer 2 (100% over 40bp) |
GATCGGAAGAGCGGTTCAGCAG... | 5086 | 5.086 | Illumina Paired End PCR Primer 2 (97% over 36bp) |
AATGATACGGCGACCACCGAGA... | 1085 | 1.085 | Illumina Single End PCR Primer 1 (100% over 40bp) |
. . . | . . . | . . . | . . . |
CGGTTCAGCAGGAATGCCGAGA... | 113 | 0.1129 | Illumina Paired End PCR Primer 2 (96% over 25bp) |
Clip
tool or else the adapter sequence will be overwritten.FASTQ Groomer
tool to convert the dataset from one FASTQ format to another. Then, we will use the Clip
tool to remove the adapter sequences from the RNA-seq dataset. This tool uses the original FASTQ files.
NGS: QC and manipulation > FASTQ Groomer
File to groom
: Choose your fastq file, e.g., RNA-Seq.fastq
Execute
to submit your job. This will generate a new FASTQ file which has been converted into a different format.
Now, we remove the adapter sequences from the RNA-seq data by using Galaxy's Clip
tool.
NGS: QC and manipulation > Clip
Library to clip
: Choose the FASTQ output from the FASTQ Groomer
toolSource
: Enter custom sequenceEnter custom clipping sequence
: Paste the previously copied overrepresented adapter sequenceOutput option
: Output both clipped and non-clipped sequencesExecute
to submit your job. This will generate a new FASTQ file which has the adapter sequences removed.
OPTIONAL: To observe the improved quality of the FASTQ after adapter sequences are removed, re-run FastQC
on the clipped FASTQ file. Under Basic statistics
, you should see that the sequence length is now variable, because some reads did not have adapter sequences and so were not clipped; other sequences contained the adapter sequence, and are therefore much shorter. You should also notes that the rest of metrics have improved in score; previously we had many bad quality scores (e.g. WARNING or FAIL), now we have more scores that pass the quality threshold (OK). If we examine the Overrepresented sequences
statistic, we see that only 1.4% of our reads now contain an adapter sequence. If desired, you may again copy and clip this adapter sequence from your RNA-seq dataset.
We will use the SendData
tool to send the clipped FASTQ files back to GenomeSpace, so that we can later align the reads using GenePattern.
Send Data > GenomeSpace Exporter
Send this dataset to GenomeSpace
: Your clipped FASTQ fileChoose target directory
: navigate to your GenomeSpace directoryfilename
: choose a filename, e.g., S.cerevisiae_wt_clipped.fastq
Execute
to submit your job. This will send your data to GenomeSpace.
NOTE: If you have not yet associated your GenomeSpace account with your GenePattern account, you will be asked to do so. If you do not yet have a GenePattern account, you can automatically generate a new account that will be associated with your GenomeSpace account.
GenomeSpace
tab, then navigate to your personal directory. (e.g., S.cerevisiae_wt_clipped.fastq
)Tool: GenePattern
1. Click on the file (e.g., S.cerevisiae_wt_clipped.fastq
) in GenomeSpace, then use the GenePattern context menu and click Launch on File
.
OR
2. Click on the file (e.g., S.cerevisiae_wt_clipped.fastq
) in GenomeSpace, then drag it to the GenePattern icon to launch.
We will use TopHat
in GenePattern to align the RNA-seq raw reads to a reference genome. This module uses the clipped FASTA/FASTQ files (e.g., S.cerevisiae_wt_clipped.fastq
), the reference gene annotations (e.g., sacCer3.gtf
) and a reference genome with an index (pre-built in GenePattern). If you are using your own data, you can load your own reference genome instead.
Modules
tab, and search for "TopHat". For this example recipe, we use TopHat
Version 8. Once the module is loaded, make sure the Version
is set to 8. Change the following parameters:bowtie index
: choose a genome from the drop-down menu. In this example we use Saccharomyces_cerevisiae_sacCer3_UCSC
.reads pair 1
: load the raw RNA-seq data, e.g., S.cerevisiae_wt_clipped.fastq
. To do this, use the GenomeSpace
tab to navigate to the directory containing your FASTQ file, then drag the file to the input box.GTF file
: load the GTF file. To do this, navigate to the GenomeSpace
tab, and navigating to the folder containing the GTF file. Load the file into the GTF file
parameter by clicking on the file and choosing Send to GTF
, or by dragging the file to the GTF file
input box.output prefix
: choose a filename prefix, e.g., wt_readsRun
to run TopHat
. This will generate several files; in this recipe, we will use the *.accepted_hits.bam
file.TopHat
on S.cerevisiae_wt_clipped.fastq
first, then again on another dataset, e.g., S.cerevisiae_mutant_clipped.fastq
. It may take several hours to run TopHat
, depending on the size of the files and whether you are using the GenePattern public server.
TopHat
job number to bring up the context menu for jobs.Reload job
, which will reload the job with the same parameters.reads pair 1
parameter.GenomeSpace
tab, navigate to the second FASTA/FASTQ file (e.g., S.cerevisiae_mutant_clipped.fastq
). Load it into the reads pair 1
parameter by dragging the file to the input box.We will use Picard.CreateSequenceDictionary
in GenePattern to create a readable sequence dictionary from our reference genome FASTA file.
We will also separately use the SAMtools.FastaIndex
file to generate a FASTA index file for our reference genome. This will make searching and aligning against the reference genome faster.
Modules
tab, and search for "Picard.CreateSequenceDictionary".GenomeSpace
tab, navigate to the directory containing your reference genome FASTA file, and drag the file to the reference sequence file parameter box.Run
to run the module. This will generate a dictionary file for the reference genome, e.g., sacCer3.dict
Save to GenomeSpace
, navigating to the directory containing your other files (e.g., sacCer3.fa
), and then clicking Save
.Modules
tab, and search for "SAMtools.FastaIndex".GenomeSpace
tab, navigate to the directory containing your reference genome FASTA file, and drag the file to the fasta file
parameter box.output prefix
parameter, enter a filename, e.g., sacCer3_indexed
. This will prevent GenePattern from overwriting the original file.Run
to run the module. This will generate a new fasta file (.fa) and a fasta index file (.fai) for the reference genome, e.g., sacCer3_indexed.fa
, and sacCer3_indexed.fa.fai
.
Save to GenomeSpace
, navigating to the directory containing your other files (e.g., sacCer3.fa
), and then clicking Save
. To save the second file, navigate to the Jobs
tab, find the file in the list, then repeat the process.We will use Picard.ReorderSAM
in GenePattern to re-order the aligned reads from TopHat
, so that they match the ordering of the reference genome.
We will also use Picard.AddorReplaceReadGroups
to rename additional parameters of each read in the RNA-seq dataset, e.g. changing the read group IDs and library annotation information. This will make it easier to later identify duplicate reads.
Modules
tab, and search for "Picard.ReorderSAM".Jobs
tab, and find the outputs from your previous TopHat
job, then drag the BAM file (e.g., wt_reads.accepted_hits.bam
) to the input file
parameter.GenomeSpace
tab, and navigate to the location of your original reference genome file, and the reference dictionary file. Drag the reference genome file (e.g., sacCer3.fa
) to the reference file
parameter.sacCer3.dict
) to the reference sequence dictionary
parameter.Run
to run the module. This will generate a reordered BAM file, e.g., wt_reads.accepted_hits.reorder.bam
Save to GenomeSpace
, navigating to the directory containing your other files (e.g., sacCer3.fa
), and then clicking Save
Modules
tab, and search for "Picard.AddorReplaceReadGroups".Jobs
tab, and find the output from the Picard.ReorderSam
job, then drag the reordered BAM file (e.g., wt_reads.accepted_hits.reorder.bam
) to the input file
parameterread group id
: Testread group library
: Testingread group platform
: Illuminaread group platform unit
: T1read group sample name
: T2Run
to run the module. This will generate a re-grouped BAM file, e.g., wt_reads.accepted_hits.reorder.rgroup.bam
Save to GenomeSpace
, navigating to the directory containing your other files (e.g., sacCer3.fa
), and then clicking Save
.We will use the Picard.MarkDuplicates
module to identify and tag reads which are duplicated in the RNA-seq dataset. This module uses the processed BAM file from the Picard.AddOrReplaceReadGroups
module.
Modules
tab, and search for "Picard.MarkDuplicates".Jobs
tab, and find the outputs from the Picard.AddOrReplaceReadGroups
job, then drag the modified BAM file (e.g., wt_reads.accepted_hits.reorder.rgroup.bam
) to the input file
parameterRun
to run the module. This will generate a new BAM file containing the marked duplicates (e.g., wt_reads.accepted_hits.reorder.rgroup.mdup.bam
), and a TXT file of metrics.
We will use the Picard.SortSam
module to create a companion index file (BAI) for our modified BAM file. The Picard.SortSam
module will sort the file and generate the index. This module uses the modified BAM file (e.g., wt_reads.accepted_hits.reorder.rgroup.mdup.bam
).
Modules
tab, and search for "Picard.SortSam". Click on the Jobs
tab, then navigate to one of the Picard.MarkDuplicates
job.Picard.SortSam
module by dragging the file into the input file
parameter.Set the output format parameter to
: BAMRun
to submit your job. This will generate a new sorted BAM file, as well as an index BAI file.
wt_reads.accepted_hits.reorder.rgroup.mdup.sorted.bam
), then choose Save to GenomeSpace
.Modules & Pipeline
start page, navigate to Jobs
. Click on the file, then choose Send to GenomeSpace
.This is an example interpretation of the results from this recipe. In particular, we will focus on interpreting the results from the FastQC
tool in Galaxy.
The Per base sequence quality
graph shows the quality of each base from the start to the end of a read. In general, areas in green are considered good scores (>30). We can see that toward the end of our reads we have some bad scores, e.g. at position 38, our reads have large error bars which potentially reflect bad scores (>20). The Per sequence GC content
graph shows the distribution of GC content for our reads. The blue line indicates the predicted, normal distribution, and the red line indicates the distribution from our read. There is an obvious spike around 55-59% GC content; this spike can indicate contamination from adapter sequences. The Overrepresented sequences
table shows that there is one sequence which is observed in over 8% of the reads in our dataset. In addition, FastQC
checks the sequences against a list of known adapter sequences, and in this case our sequence matches an Illumina paired end PCR primer. Therefore, we know this is a definite source of error in our reads.
After removing the adapter sequences, we can run FastQC
again to see that our data is much improved. The Per base sequence quality
graph shows that all the bases in the read have high quality, across the read. In particular, no positions in the read have a quality score which <20 on the y-axis. The Per sequence GC content
graph shows that the distribution of GC content in our dataset (red line) is now comparable to the predicted distribution (blue line). This suggests the cause of the GC spike in the original dataset is due to adapter sequences, which we have now removed. Finally, the Overrepresented sequences
table shows that only 1.4% of our reads have an adapter sequence. This is a significant improvement, compared to the 8% we had previously.
These results suggest that our RNA-seq dataset was contaminated with adapter sequences and was of poor quality, compared with the dataset after adapter sequences were removed. However, the results in this example are not necessarily significant and are only a simple representation of possible results.